IBM 2004 Annual Report Download - page 21
Download and view the complete annual report
Please find page 21 of the 2004 IBM annual report below. You can navigate through the pages in the report by either clicking on the pages listed below, or by using the keyword search tool below to find specific information within the annual report.-
 1
1 -
2
-
3
-
4
-
5
-
6
-
7
-
8
-
9
-
10
-
 11
11 -
 12
12 -
 13
13 -
 14
14 -
 15
15 -
 16
16 -
 17
17 -
 18
18 -
 19
19 -
 20
20 -
 21
21 -
 22
22 -
 23
23 -
 24
24 -
 25
25 -
 26
26 -
 27
27 -
 28
28 -
 29
29 -
 30
30 -
 31
31 -
32
-
33
-
34
-
35
-
36
-
37
-
38
-
39
-
40
-
41
-
42
-
43
-
44
-
45
-
46
-
47
-
48
-
49
-
50
-
51
-
52
-
53
-
54
-
55
-
56
-
57
-
58
-
59
-
60
-
61
-
62
-
63
-
64
-
65
-
66
-
67
-
68
-
69
-
70
-
71
-
72
-
73
-
74
-
75
-
76
-
77
-
78
-
79
-
80
-
81
-
82
-
83
-
84
-
85
-
86
-
87
-
88
-
89
-
90
-
91
-
92
-
93
-
94
-
95
-
96
-
97
-
98
-
99
-
100
 |
 |

MANAGEMENT DISCUSSION
International Business Machines Corporation and Subsidiary Companies
19
ibm annual report 2004
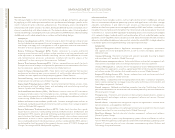
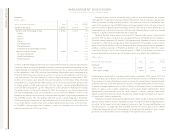
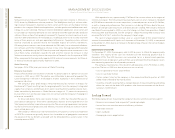
The following table presents each segment’s revenue as a percentage of the com-
pany’s total:
FOR THE YEAR ENDED DECEMBER 31: 2004 2003
Global Services 48.0% 47.8%
Hardware 32.3 31.7
Software 15.7 16.1
Global Financing 2.7 3.2
Enterprise Investments/Other 1.3 1.2
Total 100.0% 100.0%
See segment discussion on pages 21 to 23 for further details on year-to-year revenue
changes by brand.
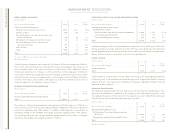
Gross Profit
Yr. to Yr.
FOR THE YEAR ENDED DECEMBER 31: 2004 2003 Change
Gross Profit Margin:
Global Services 25.1% 25.2% (0.1) pts.
Hardware 29.6 27.8 1.8
Software 87.3 86.5 0.8
Global Financing 60.0 55.8 4.2
Enterprise Investments/Other 40.3 43.4 (3.1)
Total 37.4% 37.0% 0.4pts.
The modest decline in Global Services gross profit margin was due to continued invest-
ment in on demand infrastructure and business transformation capabilities, and less
contribution from the higher margin Maintenance business.
The increase in Hardware margins was primarily due to yield improvements in the
Microelectronics business and margin improvements in zSeries servers, xSeries servers,
storage products and personal computers, as well as the impact of certain hedging trans-
actions (see “Anticipated Royalties and Cost Transactions” on page 66).
The Software margin increased due to growth in software revenue, as well as produc-
tivity improvements in the company’s support and distribution models.
The increase in the Global Financing margin was primarily driven by a mix change
towards higher margin financing revenue and away from lower margin used equipment
sales and improved margins from financing revenue.
The cost savings generated by the company’s supply chain initiatives also contributed
to the company’s overall margin improvement, but as discussed on page 16, the company
has passed a portion of the savings to clients to improve competitive leadership and gain
market share in key industry sectors. In addition, an increase in retirement-related plan
costs of approximately $490 million compared to 2003 impacted overall segment margins.
See segment discussion on pages 21 to 23 for further details on gross profit.
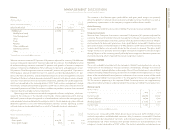
Expense
(Dollars in millions)
Yr. to Yr.
FOR THE YEAR ENDED DECEMBER 31: 2004 2003 Change
Total expense and other income $«24,004 $«22,144 8.4%
Expense to Revenue (E/R)24.9% 24.8% 0.1pts.
Total expense and other income increased 8.4 percent (5.4 percent adjusting for currency)
in 2004 versus 2003. The increase was primarily due to higher retirement-related plan
costs, Research, development and engineering expense and the effect of currency trans-
lation on expense. For additional information regarding the increase in Total expense and
other income, see the following analyses by category:
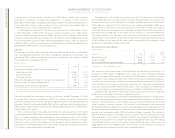
Selling, General and Administrative (SG&A)
(Dollars in millions)
Yr. to Yr.
FOR THE YEAR ENDED DECEMBER 31: 2004 2003*Change
Selling, general and administrative expense:
Selling, general and administrative— base $«17,584 $«15,787 11.4%
Advertising and promotional expense 1,335 1,406 (5.1)
Workforce reductions— ongoing 332 454 (26.9)
Bad debt expense 133 205 (35.3)
Total $«19,384 $«17,852 8.6%
*Reclassified to conform with 2004 presentation.
Total SG&A expense increased 8.6 percent (5.1 percent adjusting for currency). The
increase was primarily driven by increased expense for retirement-related plan costs of
approximately $515 million, which included a one-time charge of $320 million related to
the partial settlement of certain legal claims against the company’s PPP (see pages 20 and
21 for further information on retirement-related benefits), unfavorable currency translation
of $626 million, and provisions for certain litigation-related expenses of $125 million in
2004. These increases were partially offset by lower workforce reductions and lower
Advertising and promotional expense. The amount of Workforce reductions— ongoing will
vary from year to year depending upon the required skills, competitive environment and
economic conditions. In addition, Bad debt expense declined primarily due to lower reserve
requirements associated with the improvement in economic conditions and improved
credit quality, as well as the lower asset base of the Global Financing receivables portfolio
(see page 37).