IBM 2004 Annual Report Download - page 32
Download and view the complete annual report
Please find page 32 of the 2004 IBM annual report below. You can navigate through the pages in the report by either clicking on the pages listed below, or by using the keyword search tool below to find specific information within the annual report.-
 1
1 -
2
-
3
-
4
-
5
-
6
-
7
-
8
-
9
-
10
-
11
-
12
-
13
-
14
-
15
-
16
-
17
-
18
-
19
-
20
-
21
-
 22
22 -
 23
23 -
 24
24 -
 25
25 -
 26
26 -
 27
27 -
 28
28 -
 29
29 -
 30
30 -
 31
31 -
 32
32 -
 33
33 -
 34
34 -
 35
35 -
 36
36 -
 37
37 -
 38
38 -
 39
39 -
 40
40 -
 41
41 -
 42
42 -
43
-
44
-
45
-
46
-
47
-
48
-
49
-
50
-
51
-
52
-
53
-
54
-
55
-
56
-
57
-
58
-
59
-
60
-
61
-
62
-
63
-
64
-
65
-
66
-
67
-
68
-
69
-
70
-
71
-
72
-
73
-
74
-
75
-
76
-
77
-
78
-
79
-
80
-
81
-
82
-
83
-
84
-
85
-
86
-
87
-
88
-
89
-
90
-
91
-
92
-
93
-
94
-
95
-
96
-
97
-
98
-
99
-
100
 |
 |

MANAGEMENT DISCUSSION
International Business Machines Corporation and Subsidiary Companies
30
ibm annual report 2004
Given the declining interest rate environment, the company reduced its discount rate
assumption for the PPP by 25 basis points to 5.75 percent on December 31, 2004. The
company will keep the expected long-term return on PPP assets at 8 percent. The actual
return on PPP plan assets in 2004 was 13 percent. With similar overall trends in these
assumptions worldwide, as well as the impact of the recent years’ changes in the market
value of plan assets, the year-to-year impact from retirement related plans on pre-tax
income in 2005 will be approximately $1.0 billion higher as compared to 2004, excluding
the 2004 one-time charge of $320 million related to the partial settlement of certain legal
claims against the PPP.
The amount of IP and custom development income has been declining in recent
years. Although it was flat in 2004, the overall declining trend may continue as the com-
pany does not expect it to be a contributor to growth. The overall level of IP is dependent
on several factors: divestitures, industry consolidation, economic conditions and the tim-
ing of new patent development.
In the normal course of business, the company expects that its effective tax rate will
approximate 30 percent. The rate will change year-to-year based on nonrecurring events
(such as the tax effect of the pension claims settlement in 2004 or a possible repatriation
charge in 2005 as described in note p, “Taxes” on page 73) as well as recurring factors
including the geographic mix of income before taxes, the timing and amount of foreign
dividends, state and local taxes, and the interaction of various global tax strategies.
american jobs creation act of 2004
In 2001, the World Trade Organization (WTO) determined that tax provisions of the FSC
Repeal and Extraterritorial Income (ETI) Exclusion Act of 2000 constituted an export subsidy
prohibited by the WTO Agreement on Subsidies and Countervailing Measures Agreement.
As a result, the U.S. enacted the American Jobs Creation Act of 2004 (the “Act”) in October
2004. The Act repeals the ETI export subsidy for transactions after 2004 with two years of
transition relief (2005–2006). The Act also provides a nine-percent deduction for income
from qualified domestic production activities which will be phased in over 2005–2010.
While the net impact of certain legislative provisions has not been fully evaluated, the
company does not expect this legislation to affect its ongoing effective tax rate for 2005
or 2006.
Also, the Act includes a temporary incentive for the company to repatriate earnings
accumulated outside the U.S. The current status of the company’s evaluation and potential
impacts are discussed in note p, “Taxes,” on page 73.
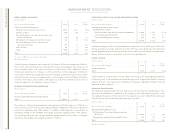
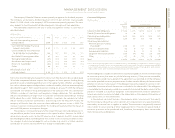
liquidity and capital resources
The company generates strong cash flow from operations, providing a source of funds
ranging between $8.8 billion and $15.4 billion per year over the past five years. The com-
pany provides for additional liquidity through several sources— a sizable cash balance,
access to global funding sources, a committed global credit facility and in 2004, the com-
pany converted a receivables securitization facility from an “uncommitted” to a “commit-
ted” facility, adding an additional source of liquidity. (See note j, “Sale and Securitization
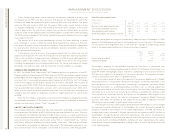
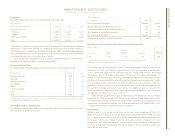
of Receivables” on page 64 for additional information.) The table below provides a sum-
mary of these major sources of liquidity as of the end of fiscal years 2000 through 2004.
Cash Flow and Liquidity Trends
(Dollars in billions)
AT DECEMBER 31: 2004 2003 2002 2001 2000
Net cash from operating activities $«15.4 $«14.6 $«13.8 $«14.0 $«««8.8
Cash and marketable securities 10.6 7.6 6.0 6.4 3.7
Size of global credit facilities 10.0 10.0 12.0 12.0 10.0
Trade receivables securitization facility 0.5 ————
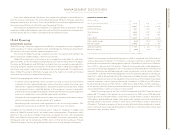
The major rating agencies’ ratings on the company’s debt securities at December 31, 2004
appear in the table below and remain unchanged over the past five years. The company
has no contractual arrangements that, in the event of a change in credit rating, would
result in a material adverse effect on its financial position or liquidity.
Standard Moody’s
and Investors Fitch
Poor’s Service Ratings
Senior long-term debt A+A1 AA-
Commercial paper A-1 Prime-1 f-1+
The company prepares its Consolidated Statement of Cash Flows in accordance with
Statement of Financial Accounting Standards (SFAS) No. 95, “Statement of Cash Flows,” on
pages 44 and 45 and highlights causes and events underlying sources and uses of cash in
that format on page 24. For purposes of running its business, the company manages,
monitors and analyzes cash flows in a different format.
As discussed on page 35, one of the company’s two primary objectives of its Global
Financing business is to generate strong return-on-equity. Increasing receivables is the
basis for growth in a financing business. Accordingly, management considers Global
Financing receivables as a profit-generating investment — not as working capital that
should be minimized for efficiency. After classifying the Cash from/(for) Global Financing
receivables as an investment, the remaining net cash flow is viewed by the company as the
Cash available for investment and for distribution to shareholders. With respect to the
company’s cash flow analysis for internal management purposes, Global Financing
accounts receivables are combined with Global Financing debt to represent the Net
Global Financing receivables (a profit-generating investment).
Over the past five years, the company generated over $59.4 billion in Cash available
for investment and for distribution to shareholders. As a result, during the period the
company invested in $21.4 billion of net capital expenditures, invested $8.0 billion in
strategic acquisitions, received $1.4 billion from divestitures and returned $33.0 billion to
shareholders through dividends and share repurchases. The amount of prospective
Returns to shareholders in the form of dividends and share repurchases will vary based
upon several factors including affordability, namely each year’s operating results, capital
expenditures, research and development, and acquisitions, as well as the factors discussed
in the following table.