IBM 2004 Annual Report Download - page 20
Download and view the complete annual report
Please find page 20 of the 2004 IBM annual report below. You can navigate through the pages in the report by either clicking on the pages listed below, or by using the keyword search tool below to find specific information within the annual report.-
 1
1 -
2
-
3
-
4
-
5
-
6
-
7
-
8
-
9
-
 10
10 -
 11
11 -
 12
12 -
 13
13 -
 14
14 -
 15
15 -
 16
16 -
 17
17 -
 18
18 -
 19
19 -
 20
20 -
 21
21 -
 22
22 -
 23
23 -
 24
24 -
 25
25 -
 26
26 -
 27
27 -
 28
28 -
 29
29 -
 30
30 -
31
-
32
-
33
-
34
-
35
-
36
-
37
-
38
-
39
-
40
-
41
-
42
-
43
-
44
-
45
-
46
-
47
-
48
-
49
-
50
-
51
-
52
-
53
-
54
-
55
-
56
-
57
-
58
-
59
-
60
-
61
-
62
-
63
-
64
-
65
-
66
-
67
-
68
-
69
-
70
-
71
-
72
-
73
-
74
-
75
-
76
-
77
-
78
-
79
-
80
-
81
-
82
-
83
-
84
-
85
-
86
-
87
-
88
-
89
-
90
-
91
-
92
-
93
-
94
-
95
-
96
-
97
-
98
-
99
-
100
 |
 |

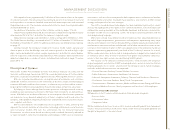
MANAGEMENT DISCUSSION
International Business Machines Corporation and Subsidiary Companies
18
ibm annual report 2004
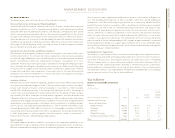
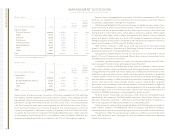
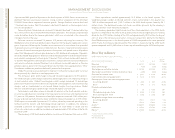
(Dollars in millions)
Yr. to Yr.
Percent
Yr. to Yr. Change
Percent Constant
FOR THE YEAR ENDED DECEMBER 31: 2004 2003*Change Currency
Industry Sector:
Financial Services $«24,339 $«22,274 9.3% 4.0%
Public 14,758 13,917 6.0 2.0
Industrial 12,582 11,850 6.2 1.1
Distribution 8,767 8,157 7.5 3.1
Communications 8,859 8,026 10.4 6.0
Small & Medium 21,162 19,537 8.3 3.2
OEM 2,885 2,634 9.6 9.3
Other 2,941 2,736 7.5 3.1
Total $«96,293 $«89,131 8.0% 3.4%
*Reclassified to conform with 2004 presentation.
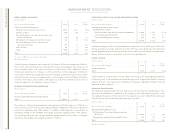
(Dollars in millions)
Yr. to Yr.
Percent
Yr. to Yr. Change
Percent Constant
FOR THE YEAR ENDED DECEMBER 31: 2004 2003 Change Currency
Geographies:
Americas $«40,064 $«38,078 5.2% 4.5%
Europe/Middle East/Africa 32,068 29,102 10.2 0.8
Asia Pacific 21,276 19,317 10.1 4.2
OEM 2,885 2,634 9.6 9.3
Total $«96,293 $«89,131 8.0% 3.4%
Revenue from all industry sectors increased in 2004 when compared to 2003, reflecting
the company’s broad capabilities and industry-specific solutions which combine technol-
ogy and high value services to solve a client’s business or IT problems. These solutions also
provide for a longer-term relationship with the client, rather than a transaction-oriented
sale. The Financial Services sector revenue growth was led by financial markets (15 per-
cent), banking (9 percent) and insurance (8 percent). The Communications sector had
strong revenue growth in Telecommunications (15 percent), while the Distribution sector
was led by the retail industry (12 percent). The Small & Medium business sector increased
as the company continued to roll out new products under the Express label that are
designed and priced specifically for customers in the 100 to 1,000 employee segment.
Revenue across all geographies increased in 2004 when compared to 2003. In the
Americas, U.S. (6 percent) and Canada (9 percent) revenue grew as did Latin America
(12 percent), notably Brazil, which grew at 15 percent.
Within Europe/Middle East/Africa, Eastern Europe, the Nordic countries, Spain (7 per-
cent) and France (3 percent) had revenue growth, while the U.K. (2 percent), Germany
(3 percent) and Italy (8 percent) declined after adjusting for currency. Asia Pacific had
strong growth in 2004, led by China, which grew at 25 percent, and the ASEAN region
(17 percent), while Japan, which is about 60 percent of Asia Pacific’s revenue, also had
growth of 5 percent. Collectively, as a result of the company’s targeted investments, the
emerging countries of China, Russia (75 percent), India (45 percent) and Brazil had revenue
growth over 25 percent in 2004 to over $4.0 billion in revenue.
OEM revenue increased in 2004 versus 2003 due primarily to continued strong
growth in the company’s Engineering & Technology Services business and improved
operational performance in the Microelectronics business.
The increase in Global Services revenue was driven by SO as it continued its steady
growth. BCS and ITS revenue also increased. Maintenance revenue increased due to the
favorable impact of currency movements.
In addition, significant progress was made in the company’s relatively new BPTS offer-
ings (see page 14) where revenue grew approximately 45 percent.
In Hardware, Systems and Technology Group, revenue increased as zSeries servers,
xSeries servers, pSeries servers and Engineering & Technology Services increased. zSeries’
strong performance resulted from clients adding new workload to the mainframe as they
build their on demand infrastructures. xSeries had strong growth, driven by its leadership
in Blades. pSeries server revenue increased as the company’s POWER5 technology was
well received by customers in 2004. Demand for the company’s Engineering & Technology
services continued to be strong. Storage Systems revenue increased due to greater
demand for external midrange disk and tape products, offset by decreases in high-end
disk products. Microelectronics revenue increased due primarily to improved yields and
increased output in the 300 millimeter factory. iSeries server revenue declined as the
transition to POWER5 technology is taking longer than previous cycles.
Personal Systems Group revenue increased in 2004, driven by strong performance
worldwide by the company’s ThinkPad mobile computers. Retail Store Solutions also
delivered strong revenue growth in 2004 due to continued demand for its products as
well as the acquisition of Productivity Solutions Inc. in November 2003.
Software revenue increased due to improved demand for Data Management products,
Tivoli software products, the WebSphere family of products and Rational products.
Operating Systems revenue increased slightly primarily due to favorable currency translation.
The decline in Global Financing revenue in 2004 versus 2003 was primarily driven by
lower used equipment sales. See pages 35 to 39 for additional information regarding
Global Financing results.