IBM 2004 Annual Report Download - page 74
Download and view the complete annual report
Please find page 74 of the 2004 IBM annual report below. You can navigate through the pages in the report by either clicking on the pages listed below, or by using the keyword search tool below to find specific information within the annual report.-
 1
1 -
2
-
3
-
4
-
5
-
6
-
7
-
8
-
9
-
10
-
11
-
12
-
13
-
14
-
15
-
16
-
17
-
18
-
19
-
20
-
21
-
22
-
23
-
24
-
25
-
26
-
27
-
28
-
29
-
30
-
31
-
32
-
33
-
34
-
35
-
36
-
37
-
38
-
39
-
40
-
41
-
42
-
43
-
44
-
45
-
46
-
47
-
48
-
49
-
50
-
51
-
52
-
53
-
54
-
55
-
56
-
57
-
58
-
59
-
60
-
61
-
62
-
63
-
 64
64 -
 65
65 -
 66
66 -
 67
67 -
 68
68 -
 69
69 -
 70
70 -
 71
71 -
 72
72 -
 73
73 -
 74
74 -
 75
75 -
 76
76 -
 77
77 -
 78
78 -
 79
79 -
 80
80 -
 81
81 -
 82
82 -
 83
83 -
 84
84 -
85
-
86
-
87
-
88
-
89
-
90
-
91
-
92
-
93
-
94
-
95
-
96
-
97
-
98
-
99
-
100
 |
 |

NOTES TO CONSOLIDATED FINANCIAL STATEMENTS
International Business Machines Corporation and Subsidiary Companies
72
ibm annual report 2004
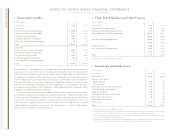
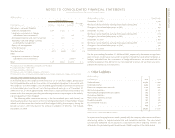
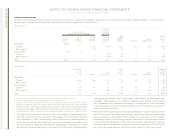
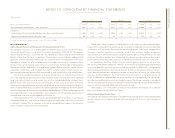
p. Ta x e s
(Dollars in millions)
FOR THE YEAR ENDED DECEMBER 31: 2004 2003 2002
Income from continuing operations before
income taxes:
U.S. operations $«««5,280 $«««4,611 $«3,838
Non-U.S. operations 6,748 6,263 3,686
Total income from continuing operations
before income taxes $«12,028 $«10,874 $«7,524
The continuing operations provision for income taxes by geographic operations is as follows:
(Dollars in millions)
FOR THE YEAR ENDED DECEMBER 31: 2004 2003 2002
U.S. operations $«1,765 $«1,234 $««««934
Non-U.S. operations 1,815 2,027 1,256
Total continuing operations provision for
income taxes $«3,580 $«3,261 $«2,190
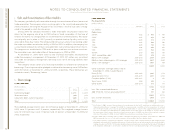
The components of the continuing operations provision for income taxes by taxing juris-
diction are as follows:
(Dollars in millions)
FOR THE YEAR ENDED DECEMBER 31: 2004 2003 2002
U.S. federal:
Current $«««(608) * $««««234 $««««287
Deferred 1,823* 339 (3)
1,215 573 284
U.S. state and local:
Current 50 46 184
Deferred 110 183 3
160 229 187
Non-U.S.:
Current 2,057 1,855 1,786
Deferred 148 604 (67)
2,205 2,459 1,719
Total continuing operations provision
for income taxes 3,580 3,261 2,190
Provision for social security, real estate,
personal property and other taxes 3,347 3,277 2,789
Total continuing operations provision for taxes $«6,927 $«6,538 $«4,979
*Included in the U.S. federal current and deferred tax provisions are a benefit of $848 million and a charge of $848 mil-
lion, respectively, due to the Internal Revenue Service settlement noted on page 73.
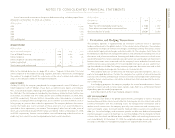
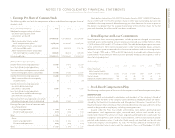
A reconciliation of the company’s continuing operations effective tax rate to the statutory
U.S. federal tax rate is as follows:
FOR THE YEAR ENDED DECEMBER 31: 2004 2003 2002
Statutory rate 35% 35% 35%
Foreign tax differential (5) (5) (7)
State and local 111
Other (1) (1) —
Effective rate 30% 30% 29%
The effect of tax law changes on deferred tax assets and liabilities did not have a material
impact on the company’s effective tax rate.
The significant components of activities that gave rise to deferred tax assets and liabil-
ities that are recorded in the Consolidated Statement of Financial Position were as follows:
deferred tax assets
(Dollars in millions)
AT DECEMBER 31: 2004 2003
Retirement benefits $«««3,908 $«««3,566
Capitalized research and development 1,794 1,907
Employee benefits 1,168 1,021
Bad debt, inventory and warranty reserves 1,050 1,092
Alternative minimum tax credits 1,032 1,344
Deferred income 612 598
Infrastructure reduction charges 333 440
Foreign tax loss carryforwards 298 311
Capital loss carryforwards 220 195
State and local tax loss carryforwards 95 205
General business credits —884
Other 2,266 2,253
Gross deferred tax assets 12,776 13,816
Less: valuation allowance 603 722
Net deferred tax assets $«12,173 $«13,094