IBM 2004 Annual Report Download - page 40
Download and view the complete annual report
Please find page 40 of the 2004 IBM annual report below. You can navigate through the pages in the report by either clicking on the pages listed below, or by using the keyword search tool below to find specific information within the annual report.-
 1
1 -
2
-
3
-
4
-
5
-
6
-
7
-
8
-
9
-
10
-
11
-
12
-
13
-
14
-
15
-
16
-
17
-
18
-
19
-
20
-
21
-
22
-
23
-
24
-
25
-
26
-
27
-
28
-
29
-
 30
30 -
 31
31 -
 32
32 -
 33
33 -
 34
34 -
 35
35 -
 36
36 -
 37
37 -
 38
38 -
 39
39 -
 40
40 -
 41
41 -
 42
42 -
 43
43 -
 44
44 -
 45
45 -
 46
46 -
 47
47 -
 48
48 -
 49
49 -
 50
50 -
51
-
52
-
53
-
54
-
55
-
56
-
57
-
58
-
59
-
60
-
61
-
62
-
63
-
64
-
65
-
66
-
67
-
68
-
69
-
70
-
71
-
72
-
73
-
74
-
75
-
76
-
77
-
78
-
79
-
80
-
81
-
82
-
83
-
84
-
85
-
86
-
87
-
88
-
89
-
90
-
91
-
92
-
93
-
94
-
95
-
96
-
97
-
98
-
99
-
100
 |
 |
MANAGEMENT DISCUSSION
International Business Machines Corporation and Subsidiary Companies
38
ibm annual report 2004
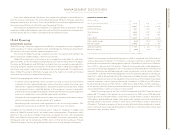
Sales of equipment, which are primarily sourced from equipment returned at end of
lease, represented 36.6 percent of Global Financing’s revenue in 2004 and 40.5 percent
in 2003. The decrease was driven primarily by lower external used equipment sales, due
to a decline in sales to business partners. The gross margin on these sales was 34.6 per-
cent and 30.2 percent in 2004 and 2003, respectively. The increase in gross margin was
primarily due to the improved profitability of internal equipment sales. In addition to sell-
ing assets sourced from end of lease, Global Financing optimizes the recovery of residual
values by leasing used equipment to new customers or extending leasing arrangements
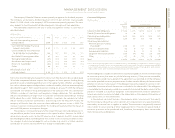
with current customers. The following table presents the recorded amount of unguaran-
teed residual value for sales-type and operating leases at December 31, 2003 and 2004.
In addition, the table presents the residual value as a percentage of the original amount
financed, and a run out of the unguaranteed residual value over the remaining lives of
these leases at December 31, 2004. In addition to the unguaranteed residual value below,
on a limited basis, Global Financing will obtain guarantees of the future value of the equip-
ment scheduled to be returned at end of lease. These third-party guarantees are used in
the determination of lease classifications for the covered equipment and provide protec-
tion against risk of loss arising from declines in equipment values for these assets. The
aggregate asset value associated with the guarantees was $700 million and $615 million
for financing transactions originated during the years ended December 31, 2004 and
2003, respectively. The associated aggregate guaranteed future value at the scheduled
end of lease was $36 million and $26 million for financing transactions originated during
the same time periods, respectively. The cost of guarantees was $4.7 million for each year.
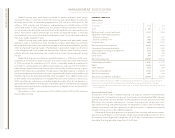
Residual Value
(Dollars in millions)
Total Amortization of 2004 Balance
2008 and
2003 2004 2005 2006 2007 Beyond
Sales-type leases $««««««845 $««««««836 $«262 $«269 $«248 $«57
Operating leases 164 164 78 46 36 4
Total unguaranteed
residual value $«««1,009 $«««1,000 $«340 $«315 $«284 $«61
Related original
amount financed $«27,820 $«25,982
Percentage 3.6% 3.8%
Debt
AT DECEMBER 31: 2004 2003
Debt to equity ratio 6.9x6.9x
Global Financing funds its operations primarily through borrowings using a debt to equity
ratio of approximately 7 to 1. The debt is used to fund Global Financing assets. The debt
is composed of intercompany loans and external debt. The terms of the intercompany
loans are set by the company to substantially match the term and currency underlying the
receivable. The inter-company loans are based on arm’s-length pricing. The following table
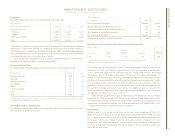
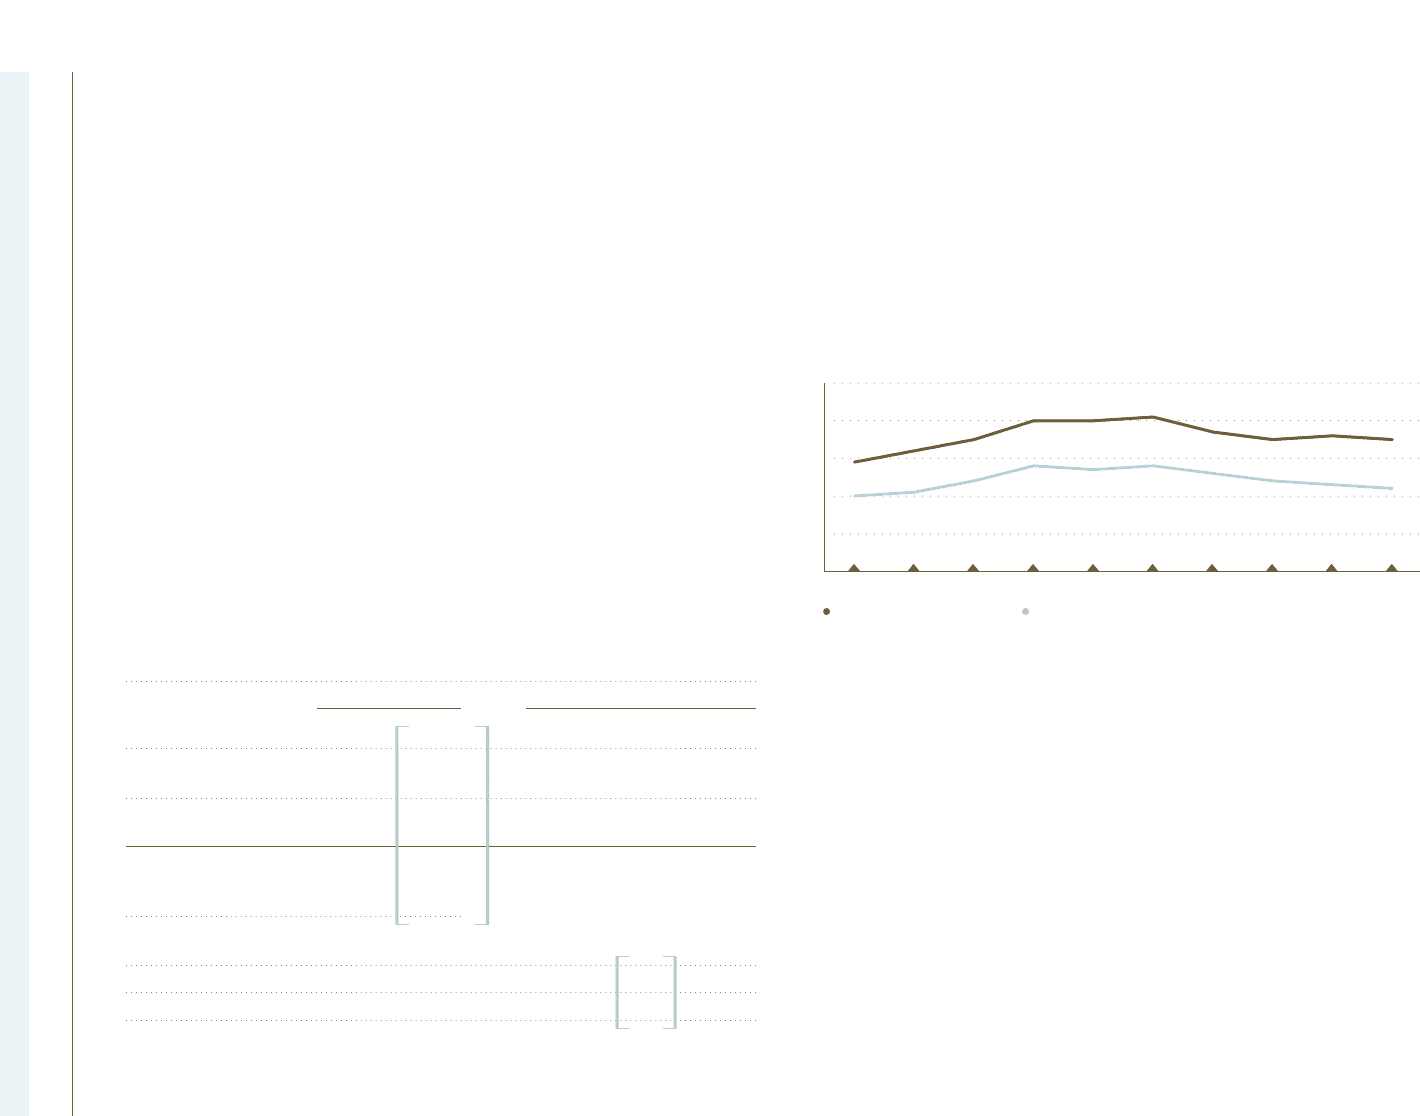
illustrates the correlation between Global Financing Assets and Global Financing Debt.
Both assets and debt are presented in the Global Financing Balance Sheet on page 36.
Global Financing Assets and Debt
(Dollars in millions)
Global Financing Assets Global Financing Debt
The company’s Global Financing business provides funding predominantly for the com-
pany’s external customers but also provides intercompany financing for the company
(internal), as described in the “Description of Business” on page 35. As previously stated,
the company manages and measures Global Financing as if it were a standalone entity
and accordingly, interest expense relating to debt supporting Global Financing’s external
customer and internal business is included in the “Global Financing Results of Operations”
on page 35 and in note x, “Segment Information,” on pages 87 through 91.
In the company’s Consolidated Statement of Earnings on pages 40 and 41, however,
the interest expense supporting Global Financing’s internal financing to the company is
reclassified from Cost of financing to Interest expense.
Liquidity and Capital Resources
Global Financing is a segment of the company and as such, is supported by the company’s
liquidity position and access to capital markets. Cash generated from operations in 2004
was deployed to reduce debt and pay dividends to the company in order to maintain an
appropriate debt to equity ratio.
$