IBM 2004 Annual Report Download - page 29
Download and view the complete annual report
Please find page 29 of the 2004 IBM annual report below. You can navigate through the pages in the report by either clicking on the pages listed below, or by using the keyword search tool below to find specific information within the annual report.-
 1
1 -
2
-
3
-
4
-
5
-
6
-
7
-
8
-
9
-
10
-
11
-
12
-
13
-
14
-
15
-
16
-
17
-
18
-
 19
19 -
 20
20 -
 21
21 -
 22
22 -
 23
23 -
 24
24 -
 25
25 -
 26
26 -
 27
27 -
 28
28 -
 29
29 -
 30
30 -
 31
31 -
 32
32 -
 33
33 -
 34
34 -
 35
35 -
 36
36 -
 37
37 -
 38
38 -
 39
39 -
40
-
41
-
42
-
43
-
44
-
45
-
46
-
47
-
48
-
49
-
50
-
51
-
52
-
53
-
54
-
55
-
56
-
57
-
58
-
59
-
60
-
61
-
62
-
63
-
64
-
65
-
66
-
67
-
68
-
69
-
70
-
71
-
72
-
73
-
74
-
75
-
76
-
77
-
78
-
79
-
80
-
81
-
82
-
83
-
84
-
85
-
86
-
87
-
88
-
89
-
90
-
91
-
92
-
93
-
94
-
95
-
96
-
97
-
98
-
99
-
100
 |
 |

MANAGEMENT DISCUSSION
International Business Machines Corporation and Subsidiary Companies
27
ibm annual report 2004
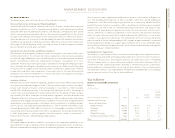
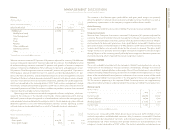
continuing operations
The increase in the company’s 2003 Income from continuing operations and diluted
earnings per share from continuing operations as compared to 2002 was due to:
•The results of the company’s productivity and efficiency initiatives, including the
benefits from the 2002 Microelectronics and productivity restructuring actions
•Stronger demand associated with the improving economy (especially during the
fourth quarter) and continued market share gains
•The charges recorded in 2002 for the 2002 actions (See note s, “2002 Actions” on
pages 73 through 76 for additional information.)
•Favorable impact of currency translation, partly offset by related hedging activities
The increase in revenue in 2003 as compared to 2002 was due to:
•Stronger demand associated with the improving economy (especially during the
fourth quarter) and continued market share gains
•The impact of the fourth quarter 2002 acquisition of PricewaterhouseCoopers’ con-
sulting business (PwCC) and the first quarter 2003 acquisition of Rational, partially
offset by decreases in revenue due to Systems and Technology Group divestitures
•The favorable impact of currency translation, which contributed 7.0 points of the
9.8 percent revenue increase
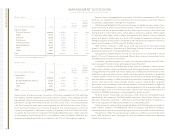
Revenue for all industry sectors increased in 2003 on an as-reported basis, which has
been reclassified to conform with the 2004 presentation. The Financial Services sector
(12.5 percent), Public sector (14.3 percent), and Industrial sector (14.8 percent) were
among the strongest, with continued growth (12.5 percent) in the Small & Medium
Business sector. These results reflect the company’s go-to-market strategy of designing
industry-specific solutions.
Full-year geographic revenue increased across all geographies. In the Americas
revenue increased 5 percent. U.S. (3 percent) and Canada (13 percent) revenue grew as
did Latin America (6 percent), notably in Brazil (26 percent). In Europe/Middle East/Africa,
revenue increased 20 percent and was highest in the U.K. (17 percent), Central Europe and
Middle East and Africa. In Asia Pacific revenue increased 13 percent, while 2003 revenue
for Japan, which is about 60 percent of the region’s revenue, increased 7 percent com-
pared with 2002. Australia/New Zealand (32 percent) also achieved strong performance
within Asia Pacific.
While OEM revenue, representing three percent of the company’s revenue, declined,
the decline was smaller than the prior year decline. The year-to-year percent change in
revenue (a decline of 21.4 percent) reflects, in large part, the company’s exit from its inter-
connect products business in 2002, as well as sluggish demand from certain OEM clients.
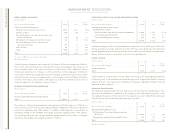
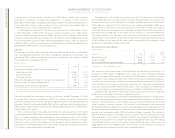
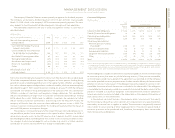
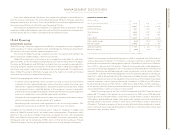
The following is an analysis of external segment results.
Global Services
Global Services revenue increased 17.3 percent (9.3 percent at constant currency) in 2003
versus 2002. SO revenue increased 14.2 percent in 2003 primarily driven by new signings.
SO continued to demonstrate its competitive advantage in delivering on demand solutions
by leveraging its business transformation skills and its scale during 2003. e-business
Hosting Services, an offering that provides Web infrastructure and application manage-
ment as an Internet-based service, continued its strong pattern of revenue growth. BCS
revenue increased 37.5 percent in 2003 due to the acquisition of PwCC in the fourth quarter
of 2002. ITS revenue increased 3.3 percent due to the favorable impact of currency move-
ments. During 2003, the company changed its reporting for certain OEM hardware sales
to the company’s clients from gross to net revenue treatment based upon a review of the
terms of these sales. The company determined that the agent-like characteristics of
these transactions were more appropriately recorded on a net revenue basis. Due to the
amounts involved, the prior year amounts were not adjusted. As a result of this change in
2003, revenue and costs for ITS were lower by $279 million in 2003 as compared to 2002,
partially offsetting the currency impact discussed above. This change had no impact on
the company’s gross profit dollars, net income or cash flows. The company signed $55 bil-
lion of services contracts in 2003, an increase of $2 billion versus 2002. The estimated
services backlog at December 31, 2003, was $120 billion.
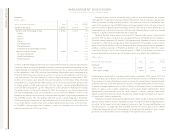
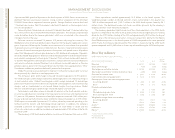
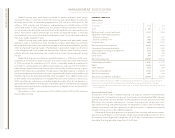
Hardware Segments
Systems and Technology Group revenue increased 1.7 percent (decreased 4.2 percent at
constant currency) in 2003 versus 2002. xSeries server products revenue increased 16.8 per-
cent due to growth in sales of high-volume servers supported by strong growth in blades.
The pSeries server revenues increased 12.5 percent due to strong demand for the 64-bit
POWER systems across both the low-end and high-end server offerings. Revenue from the
zSeries servers increased 7.4 percent. The total delivery of zSeries computing power as
measured in MIPS increased more than 28 percent in 2003 as compared to 2002. This
increase was offset by lower average price per MIPS in 2003 of 19 percent versus 2002.
Revenue from the iSeries servers increased in all four quarters of 2003 when compared to
2002. Storage Systems revenue increased 9.8 percent due to growth in external disk and
tape products.
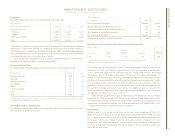
Microelectronics revenue declined 31.6 percent in 2003 versus 2002 driven by actions
taken in 2002 to refocus and redirect its business to high-end foundry, ASICs and standard
products. These actions included the divestiture of multiple non-core businesses. There
was also sluggish demand from certain OEM clients that contributed to this decline.
Personal Systems Group revenue increased 3.1 percent (down 2.5 percent at constant
currency) in 2003 versus 2002. Revenue from mobile personal computers increased
(10.9 percent) due to strong demand and was offset by lower desktop personal computer
revenue (4.0 percent). The decreased desktop revenue primarily reflects the fact that
increased volume gains were not enough to offset a reduction in price due to decreasing
commodity costs.