IBM 2004 Annual Report Download - page 28
Download and view the complete annual report
Please find page 28 of the 2004 IBM annual report below. You can navigate through the pages in the report by either clicking on the pages listed below, or by using the keyword search tool below to find specific information within the annual report.-
 1
1 -
2
-
3
-
4
-
5
-
6
-
7
-
8
-
9
-
10
-
11
-
12
-
13
-
14
-
15
-
16
-
17
-
 18
18 -
 19
19 -
 20
20 -
 21
21 -
 22
22 -
 23
23 -
 24
24 -
 25
25 -
 26
26 -
 27
27 -
 28
28 -
 29
29 -
 30
30 -
 31
31 -
 32
32 -
 33
33 -
 34
34 -
 35
35 -
 36
36 -
 37
37 -
 38
38 -
39
-
40
-
41
-
42
-
43
-
44
-
45
-
46
-
47
-
48
-
49
-
50
-
51
-
52
-
53
-
54
-
55
-
56
-
57
-
58
-
59
-
60
-
61
-
62
-
63
-
64
-
65
-
66
-
67
-
68
-
69
-
70
-
71
-
72
-
73
-
74
-
75
-
76
-
77
-
78
-
79
-
80
-
81
-
82
-
83
-
84
-
85
-
86
-
87
-
88
-
89
-
90
-
91
-
92
-
93
-
94
-
95
-
96
-
97
-
98
-
99
-
100
 |
 |

MANAGEMENT DISCUSSION
International Business Machines Corporation and Subsidiary Companies
26
ibm annual report 2004
4 percent on MIPS growth of 6 percent in the fourth quarter of 2004. iSeries server revenue
declined 9 percent year-to-year, however, strong customer acceptance of the refreshed
POWER5 iSeries drove sequential revenue growth. Storage Products revenue declined
11 percent year-to-year. Total Disk products declined 15 percent as the company transi-
tions to new products.
Personal Systems Group revenue increased 1.8 percent (declined 1.7 percent adjusting
for currency) driven by increased ThinkPad mobile computers. The company experienced
some disruption due to the Lenovo agreement, which was announced in the seasonally
strongest month of the year.
Software revenue increased 7.0 percent (2.9 percent adjusting for currency). The
WebSphere family of software products grew 18 percent for the quarter. Application servers
grew 33 percent following the October announcement of a new release that provided
improved security and integration of Web Services. Business Integration products grew
17 percent. Rational revenue grew 8 percent in the quarter, with growth across all product
areas. Data Management software grew 8 percent as DB2 database software grew 15 percent,
driven by double-digit growth in both host and distributed platforms and distributed enter-
prise content management software grew 31 percent. Tivoli software increased 25 percent,
as Systems Management software grew 31 percent, storage software increased 19 percent
and security software increased 9 percent. Lotus software increased 5 percent as Domino
products grew 2 percent for the quarter driven by the Notes messaging products. Other
Foundation middleware products declined 2 percent for the quarter.
Global Financing revenue declined 10.4 percent (13.5 percent adjusting for currency)
driven primarily by a decline in used equipment sales.
The company’s gross profit margin increased 0.8 percentage points to 39.2 percent.
The Hardware gross profit margin improved 2 percentage points with improving margins
in most product areas. Global Financing gross profit margin improved 7.5 percentage
points to 59.7 percent primarily driven by improved used equipment sales and financing
margins and an improvement in mix toward higher margin financing revenue. Global
Services and Software gross profit margin improved slightly year-over-year.
Total expense and other income increased 6.4 percent in the fourth quarter and rev-
enue increased 6.8 percent resulting in the total expense-to-revenue ratio improvement of
0.1 point to 23.4 percent. Retirement-related plan expenses increased $150 million year-
to-year and were partially offset by lower workforce rebalancing expense of $75 million.
RD&E expense increased 8.2 percent or $112 million, driven by increased spending in the
Software and the Systems and Technology Group segments. In addition, the company
recorded a provision for litigation-related expenses of $125 million in SG&A and the
effects of currency was an addition to expense of approximately $150 million in the fourth
quarter of 2004.
The company’s 2004 fourth quarter effective tax rate was 30.0 percent, the same as 2003.
Share repurchases totaled approximately $2.9 billion in the fourth quarter. The
weighted-average number of diluted common shares outstanding in the quarter was
1,691.6 million compared with 1,745.7 million in the 2003 fourth quarter, lower by 54.1
million shares. The decreased amount of shares was driven primarily by the company’s
ongoing common share repurchase program.
The company generated slightly lower cash flows from operations in the 2004 fourth
quarter as compared to the 2003 fourth quarter primarily due to higher pension funding
driven by the $700 million funding of the PPP and approximately $500 million funding of
non-U.S. plans. The company also had an increase in acquisitions (primarily the Maersk
Data/DMdata acquisition in the fourth quarter of 2004) compared to the same period of
2003. Finally, the company repurchased $2,932 million in shares during the 2004 fourth
quarter compared with $3,069 million in shares repurchased during the 2003 fourth quarter.
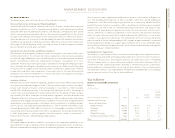
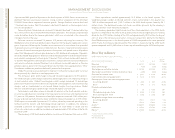
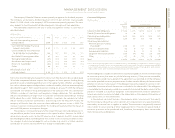
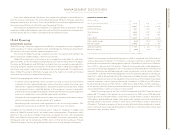
Prior Year in Review
(Dollars and shares in millions except per share amounts)
Yr. to Yr.
FOR THE YEAR ENDED DECEMBER 31: 2003 2002 Change
Revenue $«««89,131 $«81,186 9.8% *
Gross profit margin 37.0% 37.3% (0.3) pts.
Total expense and other income $÷«22,144 $«22,760 (2.7) %
Total expense and other income-to-revenue ratio 24.8% 28.0% (3.2) pts.
Provision for income taxes $«÷÷3,261 $«««2,190 48.9%
Income from continuing operations $÷÷«7,613 $«««5,334 42.7%
Earnings per share from continuing operations:
Assuming dilution $÷÷÷«4.34 $«««««3.07 41.4%
Basic $÷÷÷«4.42 $÷÷«3.13 41.2%
Discontinued operations:
Loss $÷÷÷÷««30 $«««1,755 NM
Diluted earnings per share $÷÷««(0.02) $««««(1.01) NM
Basic earnings per share $«÷÷«(0.02) $««««(1.03) NM
Weighted-average shares outstanding:
Assuming dilution 1,756.1 1,730.9 1.5%
Basic 1,721.6 1,703.2 1.1%
Assets** $«104,457 $«96,484 8.3%
Liabilities** $«÷76,593 $«73,702 3.9%
Equity** $«÷27,864 $«22,782 22.3%
*2.8 percent at constant currency
** at December 31
NM— Not Meaningful