IBM 2004 Annual Report Download - page 64
Download and view the complete annual report
Please find page 64 of the 2004 IBM annual report below. You can navigate through the pages in the report by either clicking on the pages listed below, or by using the keyword search tool below to find specific information within the annual report.-
 1
1 -
2
-
3
-
4
-
5
-
6
-
7
-
8
-
9
-
10
-
11
-
12
-
13
-
14
-
15
-
16
-
17
-
18
-
19
-
20
-
21
-
22
-
23
-
24
-
25
-
26
-
27
-
28
-
29
-
30
-
31
-
32
-
33
-
34
-
35
-
36
-
37
-
38
-
39
-
40
-
41
-
42
-
43
-
44
-
45
-
46
-
47
-
48
-
49
-
50
-
51
-
52
-
53
-
 54
54 -
 55
55 -
 56
56 -
 57
57 -
 58
58 -
 59
59 -
 60
60 -
 61
61 -
 62
62 -
 63
63 -
 64
64 -
 65
65 -
 66
66 -
 67
67 -
 68
68 -
 69
69 -
 70
70 -
 71
71 -
 72
72 -
 73
73 -
 74
74 -
75
-
76
-
77
-
78
-
79
-
80
-
81
-
82
-
83
-
84
-
85
-
86
-
87
-
88
-
89
-
90
-
91
-
92
-
93
-
94
-
95
-
96
-
97
-
98
-
99
-
100
 |
 |
NOTES TO CONSOLIDATED FINANCIAL STATEMENTS
International Business Machines Corporation and Subsidiary Companies
62
ibm annual report 2004
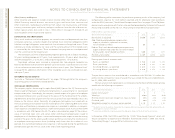
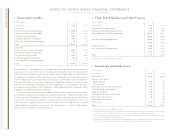
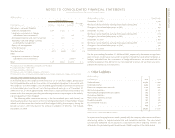
f. Financing Receivables
(Dollars in millions)
AT DECEMBER 31: 2004 2003
Short-term:
Net investment in sales-type leases $«««5,074 $«««5,940
Commercial financing receivables 5,571 5,653
Customer loans receivable 4,485 5,235
Installment payment receivables 641 657
Other non-Global Financing related 30 98
Total $«15,801 $«17,583
Long-term:
Net investment in sales-type leases $«««6,049 $«««6,010
Commercial financing receivables 139 197
Customer loans receivable 4,491 4,300
Installment payment receivables 271 217
Other non-Global Financing related —17
Total $«10,950 $«10,741
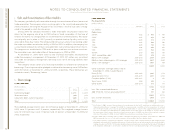
Net investment in sales-type leases is for leases that relate principally to the company’s
equipment and are generally for terms ranging from two to five years. Net investment in
sales-type leases includes unguaranteed residual values of $836 million and $845 million
at December 31, 2004 and 2003, respectively, and is reflected net of unearned income of
$1,077 million and $1,227 million and of allowance for uncollectible accounts of $269 mil-
lion and $337 million at those dates, respectively. Scheduled maturities of minimum lease
payments outstanding at December 31, 2004, expressed as a percentage of the total,
are approximately as follows: 2005, 48 percent; 2006, 28 percent; 2007, 16 percent; 2008,
6 percent; and 2009 and beyond, 2 percent.
Customer loans receivable are provided by Global Financing to the company’s clients
to finance the purchase of the company’s software and services. Global Financing is one
of many sources of funding from which clients can choose. Separate contractual relation-
ships on these financing arrangements are generally for terms ranging from two to five
years requiring straight-line payments over the term. Each financing contract is priced
independently at competitive market rates. The company has a history of enforcing the
terms of these separate financing agreements.
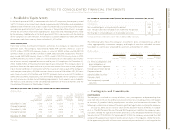
g. Plant, Rental Machines and Other Property
(Dollars in millions)
AT DECEMBER 31: 2004 2003*
Land and land improvements $««««««840 $««««««865
Buildings and building improvements 9,100 9,261
Plant, laboratory and office equipment 22,701 22,317
32,641 32,443
Less: Accumulated depreciation 18,973 19,190
13,668 13,253
Rental machines 3,744 3,710
Less: Accumulated depreciation 2,237 2,274
1,507 1,436
Total $«15,175 $«14,689
*Reclassified to conform with 2004 presentation.
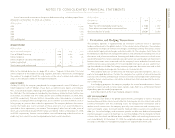
h. Investments and Sundry Assets
(Dollars in millions)
AT DECEMBER 31: 2004 2003*
Deferred taxes $«3,024 $«4,288
Alliance investments:
Equity method 550 560
Cost method 309 234
Deferred transition and set-up costs** 357 227
Other deferred arrangements** 215 161
Long-term deposits 209 143
Marketable securities—non-current 58 59
Derivatives—non-current+48 695
Receivable from Hitachi++ —358
Other assets 698 569
Total $«5,468 $«7,294
*Reclassified to conform with 2004 presentation.
** Deferred transition and set-up costs and other deferred arrangements are related to Global Services client arrange-
ments. Also see note a, “Significant Accounting Policies” on page 51 for additional information.
+See note l, “Derivatives and Hedging Transactions” on pages 65 to 67 for the fair value of all derivatives reported in
the Consolidated Statement of Financial Position.
++ At December 31, 2004, this balance was transferred to Other accounts receivable as amount is collectible in 2005.
Also, see note c, “Acquisitions/Divestitures” on pages 60 and 61 for additional information.