IBM 2004 Annual Report Download - page 22
Download and view the complete annual report
Please find page 22 of the 2004 IBM annual report below. You can navigate through the pages in the report by either clicking on the pages listed below, or by using the keyword search tool below to find specific information within the annual report.-
 1
1 -
2
-
3
-
4
-
5
-
6
-
7
-
8
-
9
-
10
-
11
-
 12
12 -
 13
13 -
 14
14 -
 15
15 -
 16
16 -
 17
17 -
 18
18 -
 19
19 -
 20
20 -
 21
21 -
 22
22 -
 23
23 -
 24
24 -
 25
25 -
 26
26 -
 27
27 -
 28
28 -
 29
29 -
 30
30 -
 31
31 -
 32
32 -
33
-
34
-
35
-
36
-
37
-
38
-
39
-
40
-
41
-
42
-
43
-
44
-
45
-
46
-
47
-
48
-
49
-
50
-
51
-
52
-
53
-
54
-
55
-
56
-
57
-
58
-
59
-
60
-
61
-
62
-
63
-
64
-
65
-
66
-
67
-
68
-
69
-
70
-
71
-
72
-
73
-
74
-
75
-
76
-
77
-
78
-
79
-
80
-
81
-
82
-
83
-
84
-
85
-
86
-
87
-
88
-
89
-
90
-
91
-
92
-
93
-
94
-
95
-
96
-
97
-
98
-
99
-
100
 |
 |

MANAGEMENT DISCUSSION
International Business Machines Corporation and Subsidiary Companies
20
ibm annual report 2004
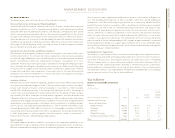
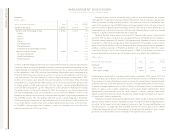
OTHER (INCOME) AND EXPENSE
(Dollars in millions)
Yr. to Yr.
FOR THE YEAR ENDED DECEMBER 31: 2004 2003 Change
Other (income) and expense:
Foreign currency transaction losses $«381 $«411 (7.5) %
Interest income (180) (152) 18.9
Net realized gains on sales of securities and
other investments (59) (54) 9.0
Writedowns of impaired investment assets 20 50 (59.6)
Net realized (gains)/losses from certain
real estate activities (71) 16 NM
2002 actions*42 2NM
Other (156) (35) NM
Total $««(23) $«238 NM
*See note s, “2002 Actions” on pages 73 through 76.
NM— Not Meaningful
Other (income) and expense was income of $23 million in 2004 versus expense of $238 mil-
lion in 2003. The improvement was primarily driven by increased gains from various asset
sales including certain real estate transactions in 2004 versus 2003, additional Interest
income generated by the company in 2004 and other nonrecurring gains/settlements
increasing in 2004 when compared to 2003. The Foreign currency transaction losses relate
primarily to losses on certain hedge contracts offset by gains on the settlement of foreign
currency receivables and payables. See pages 33 and 34 for additional discussion of
currency impacts on the company’s financial results.
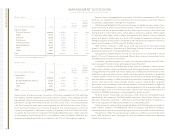
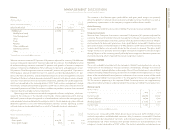
RESEARCH, DEVELOPMENT AND ENGINEERING
(Dollars in millions)
Yr. to Yr.
FOR THE YEAR ENDED DECEMBER 31: 2004 2003 Change
Research, development and engineering:
Total $«5,673 $«5,077 11.7%
The increase in Research, development and engineering (RD&E) expense in 2004 versus
2003 was primarily the result of increased spending in middleware software including new
acquisitions (approximately $240 million). In addition, RD&E expense increased due to
spending related to the POWER5 technology initiatives (approximately $140 million),
increased spending on new storage products (approximately $50 million), and higher
retirement-related plan costs (approximately $77 million).
INTELLECTUAL PROPERTY AND CUSTOM DEVELOPMENT INCOME
(Dollars in millions)
Yr. to Yr.
FOR THE YEAR ENDED DECEMBER 31: 2004 2003 Change
Intellectual property and custom
development income:
Sales and other transfers of intellectual property $÷÷466 $««««562 (17.1) %
Licensing/royalty-based fees 393 338 16.3
Custom development income 310 268 15.7
Total $«1,169 $«1,168 0.2%
Intellectual property and custom development income was flat in 2004 versus 2003. The
timing and amount of Sales and other transfers of IP may vary significantly from period to
period depending upon the timing of divestitures, industry consolidation, economic con-
ditions and the timing of new patents and know-how development.
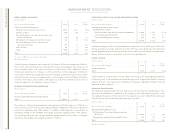
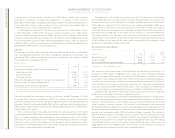
INTEREST EXPENSE
(Dollars in millions)
Yr. to Yr.
FOR THE YEAR ENDED DECEMBER 31: 2004 2003 Change
Interest expense:
Total $«139 $«145 (4.6) %
Interest expense is presented in Cost of Global Financing in the Consolidated Statement
of Earnings only if the related external borrowings are to support the Global Financing
external business. See page 38 for additional information regarding Global Financing
debt and interest expense.
Retirement-Related Benefits
The following table provides the total pre-tax cost for all retirement-related plans. Cost
amounts are included as an addition to the company’s cost and expense amounts in the
Consolidated Statement of Earnings within the caption (e.g., Cost, SG&A, RD&E) relating to
the job function of the individuals participating in the plans.
(Dollars in millions)
Yr. to Yr.
FOR THE YEAR ENDED DECEMBER 31: 2004 2003 Change
Retirement-related plans cost:
Defined benefit and contribution pension
plans cost $«1,072 $«««27 NM
Nonpension postretirement benefits costs 372 335 11.0%
Total $«1,444 $«362 NM
NM— Not Meaningful