IBM 2004 Annual Report Download - page 90
Download and view the complete annual report
Please find page 90 of the 2004 IBM annual report below. You can navigate through the pages in the report by either clicking on the pages listed below, or by using the keyword search tool below to find specific information within the annual report.-
 1
1 -
2
-
3
-
4
-
5
-
6
-
7
-
8
-
9
-
10
-
11
-
12
-
13
-
14
-
15
-
16
-
17
-
18
-
19
-
20
-
21
-
22
-
23
-
24
-
25
-
26
-
27
-
28
-
29
-
30
-
31
-
32
-
33
-
34
-
35
-
36
-
37
-
38
-
39
-
40
-
41
-
42
-
43
-
44
-
45
-
46
-
47
-
48
-
49
-
50
-
51
-
52
-
53
-
54
-
55
-
56
-
57
-
58
-
59
-
60
-
61
-
62
-
63
-
64
-
65
-
66
-
67
-
68
-
69
-
70
-
71
-
72
-
73
-
74
-
75
-
76
-
77
-
78
-
79
-
 80
80 -
 81
81 -
 82
82 -
 83
83 -
 84
84 -
 85
85 -
 86
86 -
 87
87 -
 88
88 -
 89
89 -
 90
90 -
 91
91 -
 92
92 -
 93
93 -
 94
94 -
 95
95 -
 96
96 -
 97
97 -
 98
98 -
 99
99 -
 100
100
 |
 |

NOTES TO CONSOLIDATED FINANCIAL STATEMENTS
International Business Machines Corporation and Subsidiary Companies
88
ibm annual report 2004
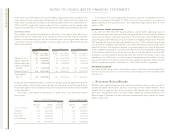
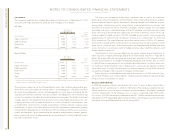
management system segment view
(Dollars in millions)
Hardware
Systems and Personal
Global Technology Systems Global Enterprise Total
FOR THE YEAR ENDED DECEMBER 31: Services Group Group Software Financing Investments Segments
2004:
External revenue $«46,213 $«17,916 $«12,794 $«15,094 $«2,607 $«1,180 $«««95,804
Internal revenue 3,131 1,051 173 1,805 1,287 8 7,455
Total revenue $«49,344 $«18,967 $«12,967 $«16,899 $«3,894 $«1,188 $«103,259
Pre-tax income/(loss) $«««4,657 $«««2,265 $««««««162 $«««4,541 $«1,494 $«««(187) $«««12,932
Revenue year-to-year change 8.5% 9.4% 12.2% 6.1% (5.6) % 11.0% 8.1%
Pre-tax income year-to-year change 3.5% 23.9% NM 19.2% 26.4% 25.8% 18.1%
Pre-tax income margin 9.4% 11.9% 1.2% 26.9% 38.4% (15.7) % 12.5%
2003:
External revenue $«42,635 $«16,469 $«11,387 $«14,311 $«2,827 $«1,065 $«««88,694
Internal revenue 2,837 865 171 1,613 1,300 5 6,791
Total revenue $«45,472 $«17,334 $«11,558 $«15,924 $«4,127 $«1,070 $«««95,485
Pre-tax income/(loss) $«««4,499 $«««1,828 $«««««(118) $«««3,808 $«1,182 $«««(252) $«««10,947
Revenue year-to-year change 16.0% 2.5% 3.3% 11.4% (0.4) % 4.3% 10.0%
Pre-tax income year-to-year change 23.0% NM NM 7.1% 23.8% 14.0% 29.2%
Pre-tax income margin 9.9% 10.5% (1.0) % 23.9% 28.6% (23.6) % 11.5%
2002:
External revenue $«36,360 $«16,195 $«11,049 $«13,074 $«3,203 $«1,022 $«««80,903
Internal revenue 2,854 711 139 1,225 939 4 5,872
Total revenue $«39,214 $«16,906 $«11,188 $«14,299 $«4,142 $«1,026 $«««86,775
Pre-tax income/(loss) $«««3,657 $««««««538 $««««««««57 $«««3,556 $««««955 $«««(293) $«««««8,470
Revenue year-to-year change 4.3% (10.8) % (7.2) % 2.7% (2.4) % (8.6) % (1.3) %
Pre-tax income year-to-year change (29.1) % (74.1) % 137.3% 12.2% (16.4) % 7.6% (23.6) %
Pre-tax income margin 9.3% 3.2% 0.5% 24.9% 23.1% (28.6) % 9.8%
NM— Not Meaningful