IBM 2004 Annual Report Download - page 39
Download and view the complete annual report
Please find page 39 of the 2004 IBM annual report below. You can navigate through the pages in the report by either clicking on the pages listed below, or by using the keyword search tool below to find specific information within the annual report.-
 1
1 -
2
-
3
-
4
-
5
-
6
-
7
-
8
-
9
-
10
-
11
-
12
-
13
-
14
-
15
-
16
-
17
-
18
-
19
-
20
-
21
-
22
-
23
-
24
-
25
-
26
-
27
-
28
-
 29
29 -
 30
30 -
 31
31 -
 32
32 -
 33
33 -
 34
34 -
 35
35 -
 36
36 -
 37
37 -
 38
38 -
 39
39 -
 40
40 -
 41
41 -
 42
42 -
 43
43 -
 44
44 -
 45
45 -
 46
46 -
 47
47 -
 48
48 -
 49
49 -
50
-
51
-
52
-
53
-
54
-
55
-
56
-
57
-
58
-
59
-
60
-
61
-
62
-
63
-
64
-
65
-
66
-
67
-
68
-
69
-
70
-
71
-
72
-
73
-
74
-
75
-
76
-
77
-
78
-
79
-
80
-
81
-
82
-
83
-
84
-
85
-
86
-
87
-
88
-
89
-
90
-
91
-
92
-
93
-
94
-
95
-
96
-
97
-
98
-
99
-
100
 |
 |

MANAGEMENT DISCUSSION
International Business Machines Corporation and Subsidiary Companies
37
ibm annual report 2004
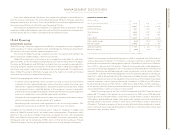
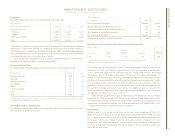
Originations
The following are total external and internal financing originations.
(Dollars in millions)
FOR THE YEAR ENDED DECEMBER 31: 2004 2003 2002
Customer finance:
External $«12,433 $«13,279 $«12,845
Internal 1,185 1,150 1,061
Commercial finance 25,566 24,291 22,546
Total $«39,184 $«38,720 $«36,452
Cash collections of both customer and commercial financing assets exceeded new financing
originations in 2004, which resulted in a net decline in financing assets from December 31,
2003. The increase in originations in 2004 and 2003 from 2003 and 2002 respectively, was
due to favorable currency movements offset by a decline in participation rates. The decline
in participation rates was in line with industry trends.
Cash generated by Global Financing in 2004 was deployed to pay the intercompany
payable and dividends to IBM as well as to reduce debt.
Financing Assets by Sector
The following are the percentage of external financing assets by industry sector.
AT DECEMBER 31: 2004 2003
Financial Services 30% 28%
Industrial 20 17
Business Partners*19 18
Distribution 910
Public 910
Communications 911
Other 46
Total 100% 100%
*Business Partners financing assets represent a portion of commercial financing inventory and accounts receivable
financing for terms generally less than 90 days.
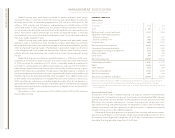
Financing Receivables and Allowances
The following table presents external financing receivables, excluding residual values, and
the allowance for doubtful accounts.
(Dollars in millions)
AT DECEMBER 31: 2004 2003
Gross financing receivables $«26,836 $«28,451
Specific allowance for doubtful accounts 654 666
Unallocated allowance for doubtful accounts 127 199
Total allowance for doubtful accounts 781 865
Net financing receivables $«26,055 $«27,586
Allowance for doubtful account coverage 2.9% 3.0%
Roll-Forward of Financing Receivables Allowance for Doubtful Accounts
(Dollars in millions)
Additions:
Reserve Bad Debts Dec. 31,
Jan. 1, 2004 Used*Expense Other** 2004
$«865 $«(237) $«105 $«48 $«781
*Represents reserved receivables, net of recoveries, that were disposed of during the period.
** Primarily represents translation adjustments.
The percentage of financing receivables reserved decreased from 3.0 percent at
December 31, 2003, to 2.9 percent at December 31, 2004 primarily due to the decrease
in the unallocated allowance for doubtful accounts. Unallocated reserves decreased
36.2 percent from $199 million at December 31, 2003 to $127 million at December 31,
2004 due to the decline in gross financing receivables combined with improved economic
conditions and improved credit quality of the portfolio. Specific reserves decreased 1.8 per-
cent from $666 million at December 31, 2003 to $654 million at December 31, 2004. The
decrease in specific reserves was due to the disposition of reserved receivables during
the period combined with lower requirements for additional specific reserves. This
lower requirement is generally due to improving economic conditions as well as portfolio
management to reduce risk in areas of concern.
Global Financing’s bad debt expense declined to $105 million for the year ended
December 31, 2004, compared with $206 million for the year ended December 31, 2003.
The decline was primarily attributed to lower reserve requirements associated with the
improvement in economic conditions and improved credit quality of the portfolio in 2004,
as compared with 2003, as well as the lower asset base.
Residual Value
Residual value is a risk unique to the financing business, and management of this risk is
dependent upon the ability to accurately project future equipment values. Global Financing
has insight into product plans and cycles for the IBM products under lease. Based upon
this product information, Global Financing continually monitors projections of future
equipment values and compares them with the residual values reflected in the portfolio.
See note a, “Significant Accounting Policies” on page 55 for the company’s accounting
policy for residual values.