IBM 2004 Annual Report Download - page 26
Download and view the complete annual report
Please find page 26 of the 2004 IBM annual report below. You can navigate through the pages in the report by either clicking on the pages listed below, or by using the keyword search tool below to find specific information within the annual report.-
 1
1 -
2
-
3
-
4
-
5
-
6
-
7
-
8
-
9
-
10
-
11
-
12
-
13
-
14
-
15
-
 16
16 -
 17
17 -
 18
18 -
 19
19 -
 20
20 -
 21
21 -
 22
22 -
 23
23 -
 24
24 -
 25
25 -
 26
26 -
 27
27 -
 28
28 -
 29
29 -
 30
30 -
 31
31 -
 32
32 -
 33
33 -
 34
34 -
 35
35 -
 36
36 -
37
-
38
-
39
-
40
-
41
-
42
-
43
-
44
-
45
-
46
-
47
-
48
-
49
-
50
-
51
-
52
-
53
-
54
-
55
-
56
-
57
-
58
-
59
-
60
-
61
-
62
-
63
-
64
-
65
-
66
-
67
-
68
-
69
-
70
-
71
-
72
-
73
-
74
-
75
-
76
-
77
-
78
-
79
-
80
-
81
-
82
-
83
-
84
-
85
-
86
-
87
-
88
-
89
-
90
-
91
-
92
-
93
-
94
-
95
-
96
-
97
-
98
-
99
-
100
 |
 |

MANAGEMENT DISCUSSION
International Business Machines Corporation and Subsidiary Companies
24
ibm annual report 2004
a combination of several factors: a decline of $1,782 million in Short-term financing
receivables as collections exceeded new originations; an increase in Other accounts
receivable of $499 million as a long-term receivable related to the sale of the HDD business
is now reflected as current; and an increase in Notes and accounts receivable—trade of
$496 million as a result of favorable currency movements.
Current liabilities increased $2,175 million primarily due to a $1,453 million increase
in Short-term debt, a $984 million increase in Accounts payable, and a $683 million
increase in Deferred income driven by Global Services business growth in 2004. These
increases were partially offset by a decrease of $747 million in Taxes payable primarily due
to the Internal Revenue Service (IRS) settlement described in note p, “Taxes” on page 73,
and $331 million in Other accrued expenses and liabilities primarily due to decreases of
approximately $160 million in restructuring accruals.
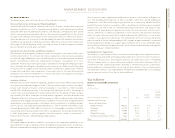
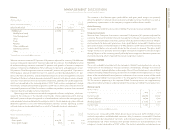
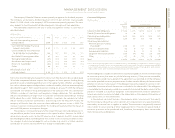
Cash Flow
The company’s cash flows from operating, investing and financing activities, as reflected in
the Consolidated Statement of Cash Flows on pages 44 and 45, are summarized in the
table below. These amounts include the cash flows associated with the company’s Global
Financing business. See pages 35 to 39.
(Dollars in millions)
FOR THE YEAR ENDED DECEMBER 31: 2004 2003
Net cash provided by/(used in) continuing operations:
Operating activities $«15,406 $«14,569
Investing activities (5,346) (5,122)
Financing activities (7,619) (7,798)
Effect of exchange rate changes on cash and cash equivalents 405 421
Net cash used in discontinued operations*(83) (162)
Net change in cash and cash equivalents $«««2,763 $«««1,908
*Does not include approximately $97 million in 2003 of net proceeds from the sale of the HDD business. Such proceeds
are included in Net cash provided by Investing activities in the table above.
Net cash provided from operating activities for the year ended December 31, 2004
increased $837 million as compared to 2003. This increase was driven primarily by
increased income from continuing operations ($835 million), the cash generated by the
change in Global Financing receivables ($582 million) and lower restructuring payments
($462 million). These increases were partially offset by additional pension funding world-
wide in 2004 of $1.2 billion.
Net investing activities increased by $224 million on a year-to-year basis. Net capital
spending decreased $190 million on a year-to-year basis. The primary drivers to the reduc-
tion in net capital spending were increased cash from equipment sales of $272 million
reflecting the cash investments of the company’s Microelectronics business strategic
partners, as well as a $25 million decrease in the company’s internal spending on plant,
rental machines and other property. This cash savings was partially offset by an increase of
$107 million in capitalized software development.
The decrease in cash used in financing activities of $179 million was attributable to
less net debt payments of $2,454 million, partially offset by higher net payments for
common stock activity of $2,186 million, and higher dividend payments of $89 million.
Within debt, on a net basis, $1,027 million of cash was used to pay off debt in 2004 versus
$3,481 million in 2003. The net cash payments of $1,027 million in 2004 were made up
of $4,538 million of cash payments to settle debt, partially offset by $2,438 million of
proceeds from new debt and $1,073 million from an increase in short-term borrowings.
The higher payments for common stock were driven by increases of approximately
$2,802 million in cash payments to repurchase stock which was partially offset by increases
of $616 million in cash received for stock issued associated with the company’s stock
option plan and employee stock purchase plan.
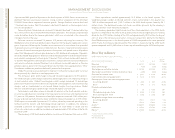
Non-current Assets and Liabilities
(Dollars in millions)
Yr. to Yr.
DECEMBER 31: 2004 2003* Change
Non-current assets $«62,213 $«59,795 4.0%
Long-term debt 14,828 16,986 (12.7)
Non-current liabilities (excluding debt) 24,810 21,984 12.9
*Reclassified to conform with 2004 presentation.
The increase in Non-current assets of $2,418 million was driven by several factors: an
increase of $1,968 million in Prepaid pension assets (see note w, “Retirement-Related
Benefits,” on pages 78 through 86); an increase of $1,516 million in Goodwill, driven by
acquisitions; and an increase of $486 million in Plant, rental machines and other property—
net, driven by currency. These increases were partially offset by a decrease of $1,826 mil-
lion in Investments and sundry assets due to a decrease of $1,264 million in deferred tax
assets primarily due to the IRS settlement (see note p, “Taxes” on page 73) and $647 million
in non-current derivatives due primarily to the reclassification of derivative instruments.
Long-term debt declined $2,158 million primarily due to the transfer of long-term
bonds to short-term debt as these items approach maturity.
Other non-current liabilities increased $2,826 million primarily due to a $1,632 million
increase in Retirement and nonpension postretirement benefit obligations, a $380 million
increase in Deferred income, a $317 million increase in Derivative liabilities and a $138
million increase in warranty accruals. The increase in the Retirement and nonpension
postretirement benefit obligations was primarily attributable to the required accounting
for the unfunded status of the non-U.S. pension plans as described on page 83, as well as
pension costs and approximately $544 million due to foreign currencies. The increase in
Deferred income was driven by Global Services resulting from new contracts with long-
term components. The increase in Derivative liabilities was primarily attributable to the
impact of foreign currencies in combination with extending beyond one year the hedging
of anticipated royalties and cost transactions during 2004 (see note l, “Derivatives and
Hedging Transactions” on pages 65 to 67). The increase in warranty accruals was primarily
related to personal computers resulting from increased volumes.