IBM 2004 Annual Report Download - page 46
Download and view the complete annual report
Please find page 46 of the 2004 IBM annual report below. You can navigate through the pages in the report by either clicking on the pages listed below, or by using the keyword search tool below to find specific information within the annual report.-
 1
1 -
2
-
3
-
4
-
5
-
6
-
7
-
8
-
9
-
10
-
11
-
12
-
13
-
14
-
15
-
16
-
17
-
18
-
19
-
20
-
21
-
22
-
23
-
24
-
25
-
26
-
27
-
28
-
29
-
30
-
31
-
32
-
33
-
34
-
35
-
 36
36 -
 37
37 -
 38
38 -
 39
39 -
 40
40 -
 41
41 -
 42
42 -
 43
43 -
 44
44 -
 45
45 -
 46
46 -
 47
47 -
 48
48 -
 49
49 -
 50
50 -
 51
51 -
 52
52 -
 53
53 -
 54
54 -
 55
55 -
 56
56 -
57
-
58
-
59
-
60
-
61
-
62
-
63
-
64
-
65
-
66
-
67
-
68
-
69
-
70
-
71
-
72
-
73
-
74
-
75
-
76
-
77
-
78
-
79
-
80
-
81
-
82
-
83
-
84
-
85
-
86
-
87
-
88
-
89
-
90
-
91
-
92
-
93
-
94
-
95
-
96
-
97
-
98
-
99
-
100
 |
 |

International Business Machines Corporation and Subsidiary Companies
44
ibm annual report 2004
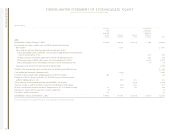
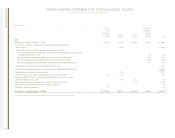
CONSOLIDATED STATEMENT OF CASH FLOWS
(Dollars in millions)
FOR THE YEAR ENDED DECEMBER 31: 2004 2003*2002*
Cash Flow from Operating Activities from Continuing Operations:
Income from continuing operations $««8,448 $««7,613 $««5,334
Adjustments to reconcile income from continuing operations
to cash provided by operating activities:
Depreciation 3,959 3,961 3,691
Amortization of intangibles 956 955 802
Deferred income taxes 2,081 1,126 (67)
Net gain on assets sales and other (420) (275) (343)
Other than temporary declines in securities and other investments 20 50 58
Noncash portion of special actions —— 1,350
Change in operating assets and liabilities, net of acquisitions/divestitures:
Receivables 2,613 2,024 4,125
Inventories (291) 293 793
Pension assets (1,284) (1,409) (4,227)
Other assets (200) (567) (44)
Accounts payable 411 617 (55)
Pension liabilities (584) (286) 83
Other liabilities (303) 467 2,288
Net Cash Provided by Operating Activities from Continuing Operations 15,406 14,569 13,788
Cash Flow from Investing Activities from Continuing Operations:
Payments for plant, rental machines and other property (4,368) (4,393) (4,753)
Proceeds from disposition of plant, rental machines and other property 1,311 1,039 775
Investments in software (688) (581) (597)
Purchases of marketable securities and other investments (8,718) (6,471) (1,582)
Proceeds from disposition of marketable securities and other investments 8,830 7,023 1,185
Divestiture of businesses 25 97 1,233
Acquisition of businesses (1,738) (1,836) (3,158)
Net Cash Used in Investing Activities from Continuing Operations (5,346) (5,122) (6,897)
*Reclassified to conform with 2004 presentation.