IBM 2004 Annual Report Download - page 14
Download and view the complete annual report
Please find page 14 of the 2004 IBM annual report below. You can navigate through the pages in the report by either clicking on the pages listed below, or by using the keyword search tool below to find specific information within the annual report.-
 1
1 -
2
-
3
-
 4
4 -
 5
5 -
 6
6 -
 7
7 -
 8
8 -
 9
9 -
 10
10 -
 11
11 -
 12
12 -
 13
13 -
 14
14 -
 15
15 -
 16
16 -
 17
17 -
 18
18 -
 19
19 -
 20
20 -
 21
21 -
 22
22 -
 23
23 -
 24
24 -
25
-
26
-
27
-
28
-
29
-
30
-
31
-
32
-
33
-
34
-
35
-
36
-
37
-
38
-
39
-
40
-
41
-
42
-
43
-
44
-
45
-
46
-
47
-
48
-
49
-
50
-
51
-
52
-
53
-
54
-
55
-
56
-
57
-
58
-
59
-
60
-
61
-
62
-
63
-
64
-
65
-
66
-
67
-
68
-
69
-
70
-
71
-
72
-
73
-
74
-
75
-
76
-
77
-
78
-
79
-
80
-
81
-
82
-
83
-
84
-
85
-
86
-
87
-
88
-
89
-
90
-
91
-
92
-
93
-
94
-
95
-
96
-
97
-
98
-
99
-
100
 |
 |

MANAGEMENT DISCUSSION
International Business Machines Corporation and Subsidiary Companies
12
ibm annual report 2004
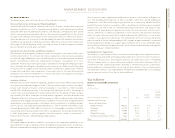
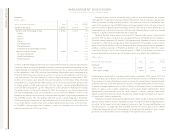
Management Discussion Snapshot
(Dollars and shares in millions except per share amounts)
Yr. to Yr.
Percent/
Margin
FOR THE YEAR ENDED DECEMBER 31: 2004 2003 Change
Revenue $÷«96,293 $«««89,131 8.0% *
Gross profit margin 37.4% 37.0% 0.4 pts.
Total expense and other income $÷«24,004 $«÷22,144 8.4%
Total expense and other income to revenue ratio 24.9% 24.8% 0.1pts.
Provision for income taxes $÷÷«3,580 $÷÷«3,261 9.8%
Income from continuing operations $÷÷«8,448 $÷÷«7,613 11.0%
Earnings per share from continuing operations:
Diluted $«««««««4.94 $«««««««4.34 13.8%
Basic $«««««««5.04 $«««««««4.42 14.0%
Weighted-average shares outstanding:
Diluted 1,708.9 1,756.1 (2.7) %
Basic 1,675.0 1,721.6 (2.7) %
Assets** $«109,183 $«104,457 4.5%
Liabilities** $«««79,436 $÷«76,593 3.7%
Equity** $«««29,747 $÷«27,864 6.8%
*3.4 percent adjusting for currency
** At December 31
continuing operations
In 2004, the company demonstrated that it could extend its leadership in a growth environ-
ment. The company delivered revenue growth of 8.0 percent and diluted earnings per
share growth of 13.8 percent. The increase in the company’s Income from continuing
operations and diluted earnings per share from continuing operations as compared to
2003 was primarily due to:
•Improving demand associated with the moderate expansion of the economy and
continued market share gains for zSeries and xSeries server products
•Continued operational improvements in the Microelectronics business
•Continued demand growth in emerging countries
•Favorable impact of currency translation
The increase in revenue in 2004 as compared to 2003 was primarily due to:
•Improved demand in Global Services and key industry sectors
•Improving demand associated with the moderate expansion of the economy and
continued market share gains for zSeries, xSeries and pSeries server products, as
well as increased revenue for personal computers
•Continued demand growth in emerging countries (up over 25 percent) and in Business
Performance Transformation Services (up approximately 45 percent)
•Favorable impact of currency translation
With regard to the way that management reviews the business, as-reported and constant
currency revenue trends were positive for all of the company’s segments (except Global
Financing), geographies and industry sectors. See pages 17 and 18 for the summary trend
rates on an as-reported and constant currency basis, as well as information for each segment
on pages 21 to 23.
The consolidated gross profit margin was relatively flat versus 2003, increasing 0.4
points. An improvement in Hardware margins (1.8 points) contributed 0.5 points to the
overall margin improvement. In addition, Global Financing margin improved 4.2 points
compared to 2003, however, this improvement had an immaterial impact on the com-
pany’s overall margin due to the size of the segment. These improvements were partially
offset by Global Services and Software— while margins in these segments were generally
flat year-to-year, the mix of these segments slightly impacted the overall company margin.
Total expense and other income increased in 2004 versus 2003 due primarily to
increased retirement-related plan costs, including the $320 million charge due to the par-
tial settlement of certain legal claims against the company’s IBM Personal Pension Plan
(PPP), and unfavorable currency translation.
Overall, retirement-related plan costs increased $1,082 million versus 2003, impacting
both gross margin and expense. See note w, “Retirement-Related Benefits” on pages 78
through 86 for additional information.
The provision for income taxes resulted in an effective tax rate of 29.8 percent for
2004, compared with the 2003 effective tax rate of 30.0 percent. The 0.2 point decrease in
the effective tax rate in 2004 was primarily due to the tax effect of the settlement of certain
pension claims in the third quarter of 2004 (highlighted above).
subsequent event
Subsequent to the company’s press release and Form 8-K filing on January 18, 2005,
announcing 2004 fourth quarter and full year financial results, the company conducted a
review of agreements for sales of third-party hardware in Japan. As a result of this review,
the company determined that certain IBM Japan employees acted improperly and incon-
sistently with the company’s policies and practices. The company is taking appropriate
disciplinary action.
Therefore, the company has reduced full year Global Services revenue and cost by
$260 million. The previously announced 2004 fourth quarter financial results included
$50 million of this adjustment. The additional $210 million adjustment is considered a
Type 1 subsequent event under generally accepted accounting principles (GAAP) and
must be reflected in the company’s 2004 financial statements. As a result, the company has
reduced Global Services revenue and cost by $75 million, $55 million, and $80 million in
the first, second and third quarters of 2004, respectively.
There was no reduction made to the company’s gross profit dollars, income from
continuing operations or cash flows.
Discontinued Operations
On December 31, 2002, the company sold its hard disk drive (HDD) business to Hitachi,
Ltd. (Hitachi). The HDD business was accounted for as a discontinued operation under
GAAP which requires that the income statement and cash flow information be reformatted
to separate the divested business from the company’s continuing operations. See pages
60 and 61 for additional information.