IBM 2004 Annual Report Download - page 69
Download and view the complete annual report
Please find page 69 of the 2004 IBM annual report below. You can navigate through the pages in the report by either clicking on the pages listed below, or by using the keyword search tool below to find specific information within the annual report.-
 1
1 -
2
-
3
-
4
-
5
-
6
-
7
-
8
-
9
-
10
-
11
-
12
-
13
-
14
-
15
-
16
-
17
-
18
-
19
-
20
-
21
-
22
-
23
-
24
-
25
-
26
-
27
-
28
-
29
-
30
-
31
-
32
-
33
-
34
-
35
-
36
-
37
-
38
-
39
-
40
-
41
-
42
-
43
-
44
-
45
-
46
-
47
-
48
-
49
-
50
-
51
-
52
-
53
-
54
-
55
-
56
-
57
-
58
-
 59
59 -
 60
60 -
 61
61 -
 62
62 -
 63
63 -
 64
64 -
 65
65 -
 66
66 -
 67
67 -
 68
68 -
 69
69 -
 70
70 -
 71
71 -
 72
72 -
 73
73 -
 74
74 -
 75
75 -
 76
76 -
 77
77 -
 78
78 -
 79
79 -
80
-
81
-
82
-
83
-
84
-
85
-
86
-
87
-
88
-
89
-
90
-
91
-
92
-
93
-
94
-
95
-
96
-
97
-
98
-
99
-
100
 |
 |

NOTES TO CONSOLIDATED FINANCIAL STATEMENTS
67
International Business Machines Corporation and Subsidiary Companies
ibm annual report 2004
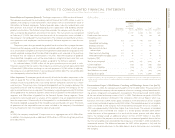
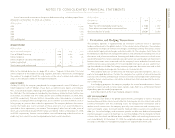
(Dollars in millions)
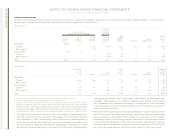
Hedge Designation
Net Non-Hedge/
AT DECEMBER 31, 2003 Fair Value Cash Flow Investment Other
Derivatives—net asset /(liability):
Debt risk management $«297 $«««(23) $«««««««— $«(10)
Long-term investments in foreign
subsidiaries (net investments) — — (27) —
Anticipated royalties and cost transactions — (643) — —
Subsidiary cash and foreign currency
asset/liability management — — — (31)
Equity risk management ———39
Other derivatives ——— 8
Total derivatives 297 (a) (666) (b) (27) (c) 6(d)
Debt:
Long-term investments in foreign
subsidiaries (net investments) — — (2,470) (e) —
Total $«297 $«(666) $«(2,497) $«÷«6
(a) Comprises assets of $1,083 million and liabilities of $786 million.
(b) Comprises liabilities of $666 million.
(c) Comprises liabilities of $27 million.
(d) Comprises assets of $73 million and liabilities of $67 million.
(e) Represents fair value of foreign denominated debt issuances formally designated as a hedge of net investment.
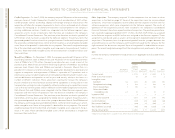
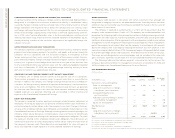
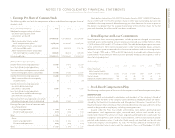
accumulated derivative gains or losses
As illustrated above, the company makes extensive use of cash flow hedges, principally in
the Anticipated royalties and cost transactions risk management program. In connection with
the company’s cash flow hedges, it has recorded approximately $653 million of net losses
in Accumulated gains and (losses) not affecting retained earnings as of December 31,
2004, net of tax, of which approximately $492 million is expected to be reclassified to net
income within the next year, providing an offsetting economic impact against the underly-
ing anticipated cash flows hedged.
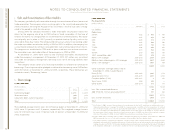
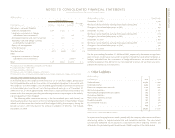
The following table summarizes activity in the Accumulated gains and (losses) not
affecting retained earnings section of the Consolidated Statement of Stockholders’ Equity
related to all derivatives classified as cash flow hedges held by the company during the
periods January 1, 2001 (the date of the company’s adoption of SFAS No. 133) through
December 31, 2004:
(Dollars in millions, net of tax) Debit/(Credit)
December 31, 2001 $«(296)
Net losses reclassified into earnings from equity during 2002 (5)
Changes in fair value of derivatives in 2002 664
December 31, 2002 $««363
Net losses reclassified into earnings from equity during 2003 (713)
Changes in fair value of derivatives in 2003 804
December 31, 2003 $««454
Net losses reclassified into earnings from equity during 2004 (463)
Changes in fair value of derivatives in 2004 662
December 31, 2004 $««653
For the years ending December 31, 2004 and 2003, respectively, there were no significant
gains or losses on derivative transactions or portions thereof that were either ineffective as
hedges, excluded from the assessment of hedge effectiveness, or associated with an
underlying exposure that did not or was not expected to occur; nor are there any antici-
pated in the normal course of business.
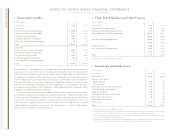
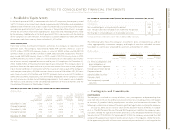
m. Other Liabilities
(Dollars in millions)
AT DECEMBER 31: 2004 2003*
Deferred taxes $«1,879 $«1,834
Deferred income 2,222 1,842
Executive compensation accruals 1,163 1,036
Restructuring actions 787 871
Postemployment/preretirement liability 562 579
Derivatives liabilities 434 117
Non-current warranty accruals 415 277
Disability benefits 357 349
Environmental accruals 218 214
Other 890 614
Total $«8,927 $«7,733
*Reclassified to conform with 2004 presentation.
In response to changing business needs, periodically the company takes certain workforce
rebalancing actions to improve productivity and competitive position. The non-current
contractually obligated future payments associated with these ongoing activities are
reflected in the postemployment/preretirement liability caption in the table above.