IBM 2004 Annual Report Download - page 83
Download and view the complete annual report
Please find page 83 of the 2004 IBM annual report below. You can navigate through the pages in the report by either clicking on the pages listed below, or by using the keyword search tool below to find specific information within the annual report.-
 1
1 -
2
-
3
-
4
-
5
-
6
-
7
-
8
-
9
-
10
-
11
-
12
-
13
-
14
-
15
-
16
-
17
-
18
-
19
-
20
-
21
-
22
-
23
-
24
-
25
-
26
-
27
-
28
-
29
-
30
-
31
-
32
-
33
-
34
-
35
-
36
-
37
-
38
-
39
-
40
-
41
-
42
-
43
-
44
-
45
-
46
-
47
-
48
-
49
-
50
-
51
-
52
-
53
-
54
-
55
-
56
-
57
-
58
-
59
-
60
-
61
-
62
-
63
-
64
-
65
-
66
-
67
-
68
-
69
-
70
-
71
-
72
-
 73
73 -
 74
74 -
 75
75 -
 76
76 -
 77
77 -
 78
78 -
 79
79 -
 80
80 -
 81
81 -
 82
82 -
 83
83 -
 84
84 -
 85
85 -
 86
86 -
 87
87 -
 88
88 -
 89
89 -
 90
90 -
 91
91 -
 92
92 -
 93
93 -
94
-
95
-
96
-
97
-
98
-
99
-
100
 |
 |

NOTES TO CONSOLIDATED FINANCIAL STATEMENTS
81
International Business Machines Corporation and Subsidiary Companies
ibm annual report 2004
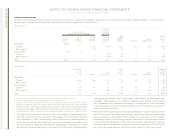
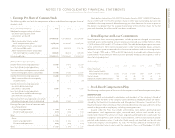
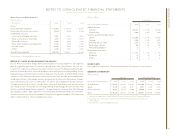
Cost/(Income) of Pension Plans
(Dollars in millions)
U.S. Plans*Non-U.S. Plans
FOR THE YEAR ENDED DECEMBER 31: 2004 2003 2002 2004 2003 2002
Service cost $««««652 $««««576 $««««650 $««««611 $««««537 $««««505
Interest cost 2,453 2,518 2,591 1,618 1,477 1,270
Expected return on plan assets (3,607) (3,703) (4,121) (2,380) (2,228) (2,132)
Amortization of transition assets (72) (144) (144) (10) (15) (12)
Amortization of prior service cost 61 61 61 517 28
Settlement of certain legal claims 320 —— ———
Recognized actuarial losses 223 —— 221 101 33
Divestitures/settlement losses ——46 ——26
Net periodic pension cost/(income) —U.S. Plan and material non-U.S. Plans 30* (692) * (917) * 65 (111) (282)
Cost of other defined benefit plans 132 132 124 187 100 58
Total net periodic pension cost/(income) for all defined benefit plans 162 (560) (793) 252 (11) (224)
Cost of defined contribution plans 338 333 315 320 265 178
Total pension plans cost/(income) recognized in the
Consolidated Statement of Earnings $««««500 $«««(227) $«««(478) $««««572 $««««254 $«««««(46)
*Represents the qualified portion of the PPP.
See beginning of note w, “Retirement-Related Benefits,” on page 79 for the company’s total retirement-related benefits cost/(income).