IBM 2004 Annual Report Download - page 84
Download and view the complete annual report
Please find page 84 of the 2004 IBM annual report below. You can navigate through the pages in the report by either clicking on the pages listed below, or by using the keyword search tool below to find specific information within the annual report.
NOTES TO CONSOLIDATED FINANCIAL STATEMENTS
International Business Machines Corporation and Subsidiary Companies
82
ibm annual report 2004
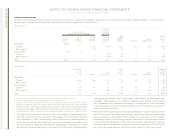
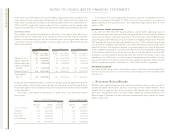
The changes in the benefit obligations and plan assets of the qualified portion of the PPP and the significant non-U.S. defined benefit plans for 2004 and 2003 were as follows:
(Dollars in millions)
PPP-Qualified Portion Non-U.S. Plans
2004 2003 2004 2003
Change in benefit obligation:
Benefit obligation at beginning of year $«42,104 $«38,357 $«31,875 $«25,699
Service cost 652 576 611 537
Interest cost 2,453 2,518 1,620 1,477
Plan participants’ contributions ——50 43
Acquisitions/divestitures, net ——93 75
Settlement of certain legal claims 320 ———
Actuarial losses 1,856 3,472 3,729 1,167
Benefits paid from trust (2,748) (2,819) (1,305) (1,093)
Direct benefit payments ——(287) (253)
Foreign exchange impact ——2,352 4,166
Plan curtailments/settlements/termination benefits ——(8) 57
Benefit obligation at end of year 44,637 42,104 38,730 31,875
Change in plan assets:
Fair value of plan assets at beginning of year 41,679 36,984 26,546 20,637
Actual return on plan assets 5,214 7,514 2,588 2,829
Employer contribution 700 —1,085 542
Acquisitions/divestitures, net ——59 7
Plan participants’ contributions ——50 43
Benefits paid from trust (2,748) (2,819) (1,305) (1,093)
Foreign exchange impact ——2,117 3,581
Fair value of plan assets at end of year 44,845 41,679 31,140 26,546
Fair value of plan assets in excess/(deficit) of benefit obligation 208 (425) (7,590) (5,329)
Unrecognized net actuarial losses 11,874 11,849 14,737 10,775
Unrecognized prior service costs 461 523 (160) (170)
Unrecognized net transition assets —(72) (3) (26)
Net prepaid pension assets recognized in the Consolidated Statement of Financial Position $«12,543 $«11,875 $«««6,984 $«««5,250
Amounts recognized in the Consolidated Statement of Financial Position captions include:
Prepaid pension assets $«12,543 $«11,875 $«««7,476 $«««6,129
Intangible assets ——44 52
Total prepaid pension assets 12,543 11,875 7,520 6,181
Retirement and nonpension postretirement benefit obligation ——(8,429) (6,982)
Accumulated gains and (losses) not affecting retained earnings ——5,088 3,888
Deferred tax assets (investments and sundry assets) ——2,805 2,163
Net amount recognized $«12,543 $«11,875 $«««6,984 $«««5,250
Accumulated benefit obligation $«43,327 $«40,423 $«36,755 $«30,240


