IBM 2004 Annual Report Download - page 79
Download and view the complete annual report
Please find page 79 of the 2004 IBM annual report below. You can navigate through the pages in the report by either clicking on the pages listed below, or by using the keyword search tool below to find specific information within the annual report.-
 1
1 -
2
-
3
-
4
-
5
-
6
-
7
-
8
-
9
-
10
-
11
-
12
-
13
-
14
-
15
-
16
-
17
-
18
-
19
-
20
-
21
-
22
-
23
-
24
-
25
-
26
-
27
-
28
-
29
-
30
-
31
-
32
-
33
-
34
-
35
-
36
-
37
-
38
-
39
-
40
-
41
-
42
-
43
-
44
-
45
-
46
-
47
-
48
-
49
-
50
-
51
-
52
-
53
-
54
-
55
-
56
-
57
-
58
-
59
-
60
-
61
-
62
-
63
-
64
-
65
-
66
-
67
-
68
-
 69
69 -
 70
70 -
 71
71 -
 72
72 -
 73
73 -
 74
74 -
 75
75 -
 76
76 -
 77
77 -
 78
78 -
 79
79 -
 80
80 -
 81
81 -
 82
82 -
 83
83 -
 84
84 -
 85
85 -
 86
86 -
 87
87 -
 88
88 -
 89
89 -
90
-
91
-
92
-
93
-
94
-
95
-
96
-
97
-
98
-
99
-
100
 |
 |

NOTES TO CONSOLIDATED FINANCIAL STATEMENTS
77
International Business Machines Corporation and Subsidiary Companies
ibm annual report 2004
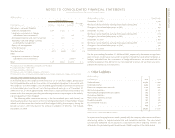
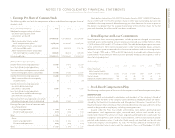
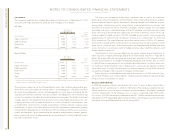
t. Earnings Per Share of Common Stock
The following table sets forth the computation of basic and diluted earnings per share of
common stock.
FOR THE YEAR ENDED DECEMBER 31: 2004 2003 2002
Weighted-average number of shares
on which earnings per share
calculations are based:
Basic 1,674,959,086 1,721,588,628 1,703,244,345
Add— incremental shares under
stock compensation plans 28,545,624 29,399,287 24,807,025
Add— incremental shares associated
with convertible notes 4,273,541 4,695,956 1,191,136
Add— incremental shares associated
with contingently issuable shares 1,094,028 406,818 1,698,548
Assuming dilution 1,708,872,279 1,756,090,689 1,730,941,054
(Dollars in millions except per share amounts)
Income from continuing operations $«8,448 $«7,613 $«5,334
Loss from discontinued operations 18 30 1,755
Net income from total operations on which
basic earnings per share is calculated $«8,430 $«7,583 $«3,579
Income from continuing operations $«8,448 $«7,613 $«5,334
Add— income effect of contingently
issuable shares (5) 2 (18)
Income from continuing operations
on which diluted earnings
per share is calculated 8,443 7,615 5,316
Loss from discontinued operations
on which basic and diluted earnings
per share are calculated 18 30 1,755
Net income from total operations on which
diluted earnings per share is calculated $«8,425 $«7,585 $«3,561
Earnings/(loss) per share of common stock:
Assuming dilution:
Continuing operations $«««4.94 $«««4.34 $«««3.07
Discontinued operations (0.01) (0.02) (1.01)
Total $«««4.93 $«««4.32 $«««2.06
Basic:
Continuing operations $«««5.04 $«««4.42 $«««3.13
Discontinued operations (0.01) (0.02) (1.03)
Total $«««5.03 $«««4.40 $«««2.10
Stock options to purchase 133,220,730 common shares in 2004, 124,840,510 common
shares in 2003 and 111,713,072 common shares in 2002 were outstanding, but were not
included in the computation of diluted earnings per share because the exercise price of
the options was greater than the average market price of the common shares for the full
year and, therefore, the effect would have been antidilutive.
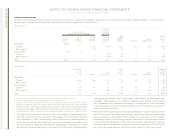
u. Rental Expense and Lease Commitments
Rental expense from continuing operations, including amounts charged to inventories
and fixed assets, and excluding amounts previously reserved, was $1,442 million in 2004,
$1,419 million in 2003 and $1,377 million in 2002. The table below depicts gross minimum
rental commitments from continuing operations under noncancelable leases, amounts
related to vacant space associated with infrastructure reduction and restructuring actions
taken through 1993, and in 1999 and 2002 (previously reserved), and sublease income
commitments. These amounts reflect activities primarily related to office space as well as
manufacturing equipment.
(Dollars in millions)
Beyond
2005 2006 2007 2008 2009 2009
Gross minimum
rental commitments
(including Vacant space) $«1,383 $«1,183 $«1,027 $«907 $«696 $«1,411
Vacant space 1006888322618
Sublease income commitments (55) (42) (42) (34) (18) (18)
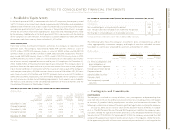
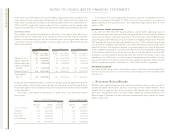
v. Stock-Based Compensation Plans
The following is a description of the terms of the company’s stock-based compensation plans:
incentive plans
Incentive awards are provided to employees and members of the company’s Board of
Directors under the terms of the company’s plans (the Plans). Employee awards are admin-
istered by the Executive Compensation and Management Resources Committee of the
Board of Directors (the Committee). The Committee determines the type and terms of the
awards to be granted to employees, including vesting provisions.
Awards under the Plans may include at-the-money stock options, premium-priced
stock options, stock appreciation rights, restricted stock, cash or stock awards, or any
combination thereof. The amount of shares originally authorized to be issued under the
company’s existing Plans is 274.1 million at December 31, 2004. Certain incentive awards
granted under previous plans, if and when those awards are canceled, can be reissued
under the company’s existing Plans. As such, 41.9 million additional awards are con-
sidered authorized to be issued under the company’s Plans as of December 31, 2004.