IBM 2004 Annual Report Download - page 36
Download and view the complete annual report
Please find page 36 of the 2004 IBM annual report below. You can navigate through the pages in the report by either clicking on the pages listed below, or by using the keyword search tool below to find specific information within the annual report.-
 1
1 -
2
-
3
-
4
-
5
-
6
-
7
-
8
-
9
-
10
-
11
-
12
-
13
-
14
-
15
-
16
-
17
-
18
-
19
-
20
-
21
-
22
-
23
-
24
-
25
-
 26
26 -
 27
27 -
 28
28 -
 29
29 -
 30
30 -
 31
31 -
 32
32 -
 33
33 -
 34
34 -
 35
35 -
 36
36 -
 37
37 -
 38
38 -
 39
39 -
 40
40 -
 41
41 -
 42
42 -
 43
43 -
 44
44 -
 45
45 -
 46
46 -
47
-
48
-
49
-
50
-
51
-
52
-
53
-
54
-
55
-
56
-
57
-
58
-
59
-
60
-
61
-
62
-
63
-
64
-
65
-
66
-
67
-
68
-
69
-
70
-
71
-
72
-
73
-
74
-
75
-
76
-
77
-
78
-
79
-
80
-
81
-
82
-
83
-
84
-
85
-
86
-
87
-
88
-
89
-
90
-
91
-
92
-
93
-
94
-
95
-
96
-
97
-
98
-
99
-
100
 |
 |

MANAGEMENT DISCUSSION
International Business Machines Corporation and Subsidiary Companies
34
ibm annual report 2004
The company regularly assesses these risks and has established policies and business
practices to protect against the adverse effects of these and other potential exposures. As
a result, the company does not anticipate any material losses from these risks.
The company’s debt in support of the Global Financing business and the geographic
breadth of the company’s operations contains an element of market risk from changes in
interest and currency rates. The company manages this risk, in part, through the use of a
variety of financial instruments including derivatives, as explained in note l, “Derivatives
and Hedging Transactions,” on pages 65 to 67.
To meet disclosure requirements, the company performs a sensitivity analysis to deter-
mine the effects that market risk exposures may have on the fair values of the company’s
debt and other financial instruments.
The financial instruments that are included in the sensitivity analysis comprise all of the
company’s cash and cash equivalents, marketable securities, long-term non-lease receiv-
ables, investments, long-term and short-term debt and all derivative financial instruments.
The company’s portfolio of derivative financial instruments generally includes interest rate
swaps, interest rate options, foreign currency swaps, forward contracts and option contracts.
To perform the sensitivity analysis, the company assesses the risk of loss in fair values
from the effect of hypothetical changes in interest rates and foreign currency exchange
rates on market-sensitive instruments. The market values for interest and foreign currency
exchange risk are computed based on the present value of future cash flows as affected by
the changes in rates that are attributable to the market risk being measured. The discount
rates used for the present value computations were selected based on market interest and
foreign currency exchange rates in effect at December 31, 2004 and 2003. The differences
in this comparison are the hypothetical gains or losses associated with each type of risk.
Information provided by the sensitivity analysis does not necessarily represent the
actual changes in fair value that the company would incur under normal market conditions
because, due to practical limitations, all variables other than the specific market risk factor
are held constant. In addition, the results of the model are constrained by the fact that
certain items are specifically excluded from the analysis, while the financial instruments
relating to the financing or hedging of those items are included by definition. Excluded
items include leased assets, forecasted foreign currency cash flows and the company’s
net investment in foreign operations. As a consequence, reported changes in the values
of some of the financial instruments impacting the results of the sensitivity analysis are not
matched with the offsetting changes in the values of the items that those instruments are
designed to finance or hedge.
The results of the sensitivity analysis at December 31, 2004, and December 31, 2003,
are as follows:
Interest Rate Risk
At December 31, 2004, a 10 percent decrease in the levels of interest rates with all other
variables held constant would result in a decrease in the fair market value of the company’s
financial instruments of $172 million as compared with a decrease of $170 million at
December 31, 2003. A 10 percent increase in the levels of interest rates with all other vari-
ables held constant would result in an increase in the fair value of the company’s financial
instruments of $153 million as compared to $152 million at December 31, 2003. Changes
in the relative sensitivity of the fair value of the company’s financial instrument portfolio for
these theoretical changes in the level of interest rates are primarily driven by changes in
the company’s debt maturity, interest rate profile and amount.
Foreign Currency Exchange Rate Risk
At December 31, 2004, a 10 percent weaker U.S. dollar against foreign currencies, with all
other variables held constant, would result in a decrease in the fair value of the company’s
financial instruments of $692 million as compared with a decrease of $283 million at
December 31, 2003. Conversely, a 10 percent stronger U.S. dollar against foreign curren-
cies, with all other variables held constant, would result in an increase in the fair value of
the company’s financial instruments of $679 million compared with $296 million at
December 31, 2003. In 2004 versus 2003, the reported increase in foreign currency
exchange rate sensitivity was primarily due to an increase in hedges of foreign cash flow.
financing risks
See the Global Financing— Description of Business on page 35 for a discussion of the
financing risks associated with the company’s Global Financing business and management’s
goals to mitigate such risks while striving for superior return on Global Financing’s equity.
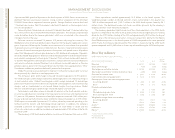
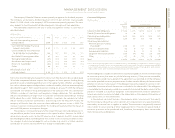
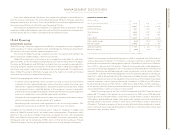
Employees and Related Workforce
Percentage Changes
FOR THE YEAR ENDED DECEMBER 31: 2004 2003 2002 2004-03 2003-02
IBM/wholly owned subsidiaries 329,001 319,273 315,889 3.0 1.1
Less-than-wholly owned subsidiaries 19,051 18,189 22,282 4.7 (18.4)
Complementary 21,225 17,695 17,250 19.9 2.6
Employees at IBM and its wholly owned subsidiaries in 2004 increased 9,728 from last
year. The company continues to invest in Global Services and Software, growth areas of
the business, through a combination of hiring and acquisitions. The company also contin-
ues to rebalance its workforce to improve IBM’s competitiveness in the marketplace and to
withdraw from certain businesses, thereby offsetting some of the growth.