IBM 2004 Annual Report Download - page 37
Download and view the complete annual report
Please find page 37 of the 2004 IBM annual report below. You can navigate through the pages in the report by either clicking on the pages listed below, or by using the keyword search tool below to find specific information within the annual report.-
 1
1 -
2
-
3
-
4
-
5
-
6
-
7
-
8
-
9
-
10
-
11
-
12
-
13
-
14
-
15
-
16
-
17
-
18
-
19
-
20
-
21
-
22
-
23
-
24
-
25
-
26
-
 27
27 -
 28
28 -
 29
29 -
 30
30 -
 31
31 -
 32
32 -
 33
33 -
 34
34 -
 35
35 -
 36
36 -
 37
37 -
 38
38 -
 39
39 -
 40
40 -
 41
41 -
 42
42 -
 43
43 -
 44
44 -
 45
45 -
 46
46 -
 47
47 -
48
-
49
-
50
-
51
-
52
-
53
-
54
-
55
-
56
-
57
-
58
-
59
-
60
-
61
-
62
-
63
-
64
-
65
-
66
-
67
-
68
-
69
-
70
-
71
-
72
-
73
-
74
-
75
-
76
-
77
-
78
-
79
-
80
-
81
-
82
-
83
-
84
-
85
-
86
-
87
-
88
-
89
-
90
-
91
-
92
-
93
-
94
-
95
-
96
-
97
-
98
-
99
-
100
 |
 |

MANAGEMENT DISCUSSION
International Business Machines Corporation and Subsidiary Companies
35
ibm annual report 2004
In less-than-wholly owned subsidiaries, the number of employees increased from last
year. The increase is primarily in the International Information Products Company, a personal
computer-related joint venture in China, which IBM has announced an agreement to sell
to Lenovo as part of the sale of the Personal Computing Division.
The company’s complementary workforce is an approximation of equivalent full-time
employees hired under temporary, part-time and limited-term employment arrangements
to meet specific business needs in a flexible and cost-effective manner.
Global Financing
description of business
Global Financing is a business segment within IBM, that is managed on an arm’s-length basis
and measured as if it were a standalone entity. Accordingly, the information presented in
this section is consistent with this separate company view.
The mission of Global Financing is to generate a return on equity. It also facilitates the
client’s acquisition of IBM hardware, software and services.
Global Financing invests in financing assets, manages the associated risks, and lever-
ages with debt, all with the objective of generating consistently strong returns on equity.
The focus on IBM products and IBM clients mitigates the risks normally associated with a
financing company. Global Financing has the benefit of both a deep knowledge of its
client base and a clear insight into the products that are being leased. This combination
allows Global Financing to effectively manage two of the major risks (credit and residual
value) that are normally associated with financing.
Global Financing comprises three lines of business:
•Customer financing provides lease and loan financing to end users and internal
customers for terms generally between two and five years. Internal financing is pre-
dominantly in support of Global Services’ long-term customer service contracts. Global
Financing also factors a selected portion of the company’s accounts receivable,
primarily for cash management purposes. All of these internal financing arrangements
are at arm’s-length rates and are based upon market conditions.
•Commercial financing provides primarily short-term inventory and accounts receiv-
able financing to dealers and remarketers of IT products.
•Remarketing sells and leases used equipment to new or existing customers. This
equipment is primarily sourced from the conclusion of lease transactions.
In addition to the strength of the economy and its impact on corporate IT budgets, key
drivers of Global Financing’s results are interest rates and originations. Originations, which
determine the asset base of Global Financing’s annuity-like business, are impacted by
IBM’s non-Global Financing sales volumes and Global Financing’s participation rates.
Participation rates are the propensity of IBM’s clients to finance their purchases through
Global Financing in lieu of paying IBM up-front cash or financing through a third party.
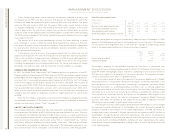
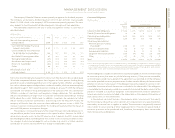
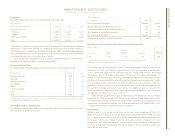
results of operations
(Dollars in millions)
FOR THE YEAR ENDED DECEMBER 31: 2004 2003 2002
External revenue $«2,607 $«2,827 $«3,203
Internal revenue 1,287 1,300 939
Total revenue 3,894 4,127 4,142
Cost 1,539 1,846 1,803
Gross profit $«2,355 $«2,281 $«2,339
Gross profit margin 60.5% 55.3% 56.5%
Pre-tax income $«1,494 $«1,182 $««««955
After-tax income*$««««937 $««««766 $««««627
Return on equity*28.6% 22.3% 17.2%
*See page 39 for the details of the After-tax income and the Return on equity calculation.
Global Financing revenue declined 5.6 percent in 2004 as compared with 2003. External
revenue decreased 7.8 percent (11.5 percent at constant currency) in 2004 versus 2003
primarily driven by external used equipment sales of $708 million in 2004 versus $928 mil-
lion in 2003, a decrease of 23.7 percent. Global Financing remarkets used equipment,
primarily resulting from equipment that is returned at end of lease both externally and
internally. Externally remarketed equipment revenue represents sales or leases to clients
and resellers. Internally remarketed equipment revenue primarily represents used equip-
ment that is sold or leased internally to the Hardware and Global Services segments. The
Hardware segment will also sell the equipment that it purchases from Global Financing to
external customers. Internal revenue decreased 1.0 percent in 2004 versus 2003 driven
by remarketing revenue of $783 million in 2004 versus $828 million in 2003, a decrease
of 5.4 percent, partially offset by commercial financing revenue of $269 million in 2004
versus $240 million in 2003, an increase of 12.2 percent.
Global Financing revenue was flat in 2003 as compared with 2002. External revenue
decreased 11.7 percent (18.0 percent at constant currency) in 2003 versus 2002 driven by
financing revenue of $1,896 million in 2003 versus $2,224 million in 2002, a decrease of
14.7 percent, due to declining interest rates and a lower average asset base, and external
used equipment sales of $931 million in 2003 versus $979 million in 2002, a decrease of
4.9 percent. The lower average asset base was primarily due to lower originations in prior
years. Internal revenue increased 38.4 percent in 2003 versus 2002 driven by internal used
equipment sales, primarily zSeries.