IBM 2004 Annual Report Download - page 23
Download and view the complete annual report
Please find page 23 of the 2004 IBM annual report below. You can navigate through the pages in the report by either clicking on the pages listed below, or by using the keyword search tool below to find specific information within the annual report.-
 1
1 -
2
-
3
-
4
-
5
-
6
-
7
-
8
-
9
-
10
-
11
-
12
-
 13
13 -
 14
14 -
 15
15 -
 16
16 -
 17
17 -
 18
18 -
 19
19 -
 20
20 -
 21
21 -
 22
22 -
 23
23 -
 24
24 -
 25
25 -
 26
26 -
 27
27 -
 28
28 -
 29
29 -
 30
30 -
 31
31 -
 32
32 -
 33
33 -
34
-
35
-
36
-
37
-
38
-
39
-
40
-
41
-
42
-
43
-
44
-
45
-
46
-
47
-
48
-
49
-
50
-
51
-
52
-
53
-
54
-
55
-
56
-
57
-
58
-
59
-
60
-
61
-
62
-
63
-
64
-
65
-
66
-
67
-
68
-
69
-
70
-
71
-
72
-
73
-
74
-
75
-
76
-
77
-
78
-
79
-
80
-
81
-
82
-
83
-
84
-
85
-
86
-
87
-
88
-
89
-
90
-
91
-
92
-
93
-
94
-
95
-
96
-
97
-
98
-
99
-
100
 |
 |

MANAGEMENT DISCUSSION
International Business Machines Corporation and Subsidiary Companies
21
ibm annual report 2004
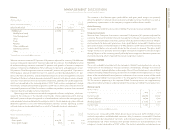
Overall, retirement-related plan costs increased $1,082 million versus 2003. On
December 31, 2003, the company lowered its PPP discount rate from 6.75 percent to
6.0 percent which increased pre-tax cost and expense by almost $200 million in 2004. In
addition, the 2004 results include a charge of $320 million due to the partial settlement of
certain legal claims against the company’s PPP. The 2004 results were also affected by
changes in the market value of plan assets as well as similar trends in the company’s other
defined benefits pension plans that contributed to the increase in costs. See note w,
“Retirement-Related Benefits” on pages 78 through 86 for additional information. The
year-to-year increase impacted gross margin, SG&A and RD&E by approximately $490 mil-
lion, $515 million and $77 million, respectively.
Provision for Income Taxes
The provision for income taxes resulted in an effective tax rate of 29.8 percent for 2004,
compared with the 2003 effective tax rate of 30.0 percent. The 0.2 point decrease in the
effective tax rate in 2004 was primarily due to the tax effect of the settlement of certain
pension claims in the third quarter of 2004.
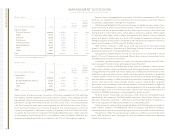
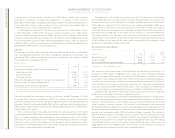
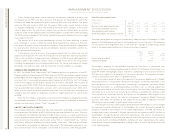
Weighted-Average Common Shares
Yr. to Yr.
FOR THE YEAR ENDED DECEMBER 31: 2004 2003 Change
Earnings per share from continuing operations:
Assuming dilution $«««««4.94 $«««««4.34 13.8%
Basic 5.04 4.42 14.0
Weighted-average shares outstanding (in millions):
Assuming dilution 1,708.9 1,756.1 (2.7) %
Basic 1,675.0 1,721.6 (2.7)
The average number of common shares outstanding assuming dilution was lower by 47.2 mil-
lion shares in 2004 versus 2003. The decrease was primarily the result of the company’s
common share repurchase program. See note n, “Stockholders’ Equity Activity,” on page
69 for additional information regarding the common share activities. Also see note t,
“Earnings Per Share of Common Stock,” on page 77.
segment details
The following is an analysis of the 2004 versus 2003 external segment results. The analysis
of 2003 versus 2002 external segment results is on pages 26 to 28.
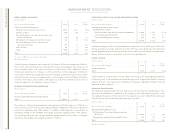
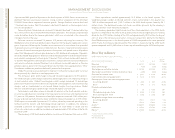
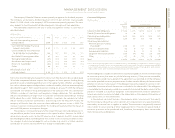
Global Services
(Dollars in millions)
Yr. to Yr.
FOR THE YEAR ENDED DECEMBER 31: 2004 2003 Change
Global Services Revenue: $«46,213 $«42,635 8.4%
Strategic Outsourcing $«19,309 $«17,124 12.8%
Business Consulting Services 13,767 12,955 6.3
Integrated Technology Services 7,441 7,099 4.8
Maintenance 5,696 5,457 4.4
Global Services revenue increased 8.4 percent (3.1 percent adjusted for currency). SO
continued to demonstrate its competitive advantage in delivering on demand solutions by
leveraging its business transformational skills and its scale during 2004. Each geography
continued year-to-year growth, with seven consecutive quarters of double-digit growth in
Europe/Middle East/Africa, excluding currency benefits. Within SO, e-business Hosting
Services, an offering that provides Web infrastructure and application management as
an Internet based service, continued its pattern of revenue growth. ITS revenue, which
excludes Maintenance, increased driven by growth in Business Continuity and Recovery
Services of 29 percent, partially offset by the revenue reduction for sales of third-party
hardware in Japan. (See page 12, “Subsequent Event” for additional information.) BCS
revenue increased driven by strong growth in BTO.BCS continued to improve its revenue
growth rate at constant currency in every quarter of the year. Maintenance revenue
increased primarily driven by favorable impacts of currency movements.
(Dollars in millions)
Yr. to Yr.
FOR THE YEAR ENDED DECEMBER 31: 2004 2003 Change
Global Services:
Gross profit $«11,576 $«10,732 7.9%
Gross profit margin 25.1% 25.2% (0.1) pts.
The Global Services gross profit dollars increased primarily due to the corresponding
increase in revenue. The gross profit margin declined due to investment in on demand infra-
structure and business transformation capabilities, as well as a lower mix of Maintenance
revenue (12 percent in 2004 versus 13 percent in 2003), which has a higher gross profit
margin than the other categories of Global Services revenue. These declines were partially
offset by improved profitability in BCS driven by improved utilization, reduced overhead
structure and an improved labor mix.