IBM 2004 Annual Report Download - page 27
Download and view the complete annual report
Please find page 27 of the 2004 IBM annual report below. You can navigate through the pages in the report by either clicking on the pages listed below, or by using the keyword search tool below to find specific information within the annual report.-
 1
1 -
2
-
3
-
4
-
5
-
6
-
7
-
8
-
9
-
10
-
11
-
12
-
13
-
14
-
15
-
16
-
 17
17 -
 18
18 -
 19
19 -
 20
20 -
 21
21 -
 22
22 -
 23
23 -
 24
24 -
 25
25 -
 26
26 -
 27
27 -
 28
28 -
 29
29 -
 30
30 -
 31
31 -
 32
32 -
 33
33 -
 34
34 -
 35
35 -
 36
36 -
 37
37 -
38
-
39
-
40
-
41
-
42
-
43
-
44
-
45
-
46
-
47
-
48
-
49
-
50
-
51
-
52
-
53
-
54
-
55
-
56
-
57
-
58
-
59
-
60
-
61
-
62
-
63
-
64
-
65
-
66
-
67
-
68
-
69
-
70
-
71
-
72
-
73
-
74
-
75
-
76
-
77
-
78
-
79
-
80
-
81
-
82
-
83
-
84
-
85
-
86
-
87
-
88
-
89
-
90
-
91
-
92
-
93
-
94
-
95
-
96
-
97
-
98
-
99
-
100
 |
 |

MANAGEMENT DISCUSSION
International Business Machines Corporation and Subsidiary Companies
25
ibm annual report 2004
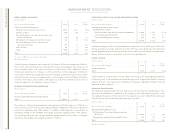
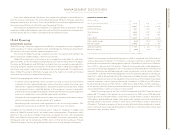
Debt
The company’s funding requirements are continually monitored and strategies are executed
to manage the company’s overall asset and liability profile. Additionally, the company
maintains sufficient flexibility to access global funding sources as needed.
(Dollars in millions)
AT DECEMBER 31: 2004 2003
Total company debt $«22,927 $«23,632
Non-Global Financing debt*««««««607 «««368
Non-Global Financing debt/capitalization 2.2% 1.5%
*Non-Global Financing debt is the company’s total external debt less the Global Financing debt described in the Global
Financing balance sheet on page 36.
Non-Global Financing debt increased $239 million and the debt-to-capital ratio at
December 31, 2004 was well within acceptable levels at 2.2 percent.
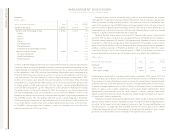
Equity
(Dollars in millions)
Yr. to Yr.
AT DECEMBER 31: 2004 2003 Change
Stockholders’ equity:
Total $«29,747 $«27,864 6.8%
The company’s total consolidated Stockholders’ equity increased $1,883 million during
2004 primarily due to an increase in the company’s retained earnings driven by net
income, partially offset by the company’s ongoing stock repurchase program and higher
dividend payments.
Off-Balance Sheet Arrangements
The company, in the ordinary course of business, entered into off-balance sheet arrange-
ments as defined by the Securities and Exchange Commission (SEC) Financial Reporting
Release 67 (FRR-67), “Disclosure in Management’s Discussion and Analysis about Off-
Balance Sheet Arrangements and Aggregate Contractual Obligations,” including: certain
guarantees, indemnifications and retained interests in assets transferred to an unconsoli-
dated entity for securitization purposes.
None of these off-balance sheet arrangements either has, or is reasonably likely to
have, a material current or future effect on financial condition, changes in financial condi-
tion, revenues or expenses, results of operations, liquidity, capital expenditures or capital
resources. See page 31 for the company’s contractual obligations.
See note o, “Contingencies and Commitments,” on page 71, for detailed information
about the company’s guarantees on certain loans and financial commitments, indemnifi-
cation arrangements and note j, “Sale and Securitization of Receivables” on page 64 for
detailed information regarding loans receivable securitization program.
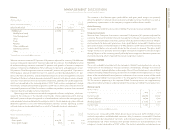
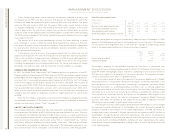
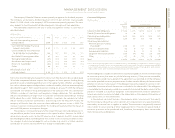
consolidated fourth quarter results
(Dollars and shares in millions except per share amounts)
Yr. to Yr.
FOR FOURTH QUARTER: 2004 2003 Change
Revenue $«27,671 $«25,913 6.8% *
Gross profit margin 39.2% 38.4% 0.8 pts.
Total expense and other income $«««6,488 $«««6,097 6.4%
Total expense and other income-to-revenue ratio 23.4% 23.5% (0.1) pts.
Provision for income taxes $«««1,309 $«««1,162 12.7%
Income from continuing operations $«««3,055 $«««2,716 12.5%
Earnings per share from continuing operations:
Assuming dilution $÷÷«1.81 $«««««1.56 16.0%
Basic $÷÷«1.84 $÷÷«1.59 15.7%
Weighted-average shares outstanding:
Assuming dilution 1,691.6 1,745.7 (3.1) %
Basic 1,659.0 1,708.5 (2.9) %
*2.7 percent increase adjusting for currency
Continuing Operations
The increase in the company’s fourth quarter 2004 Income from continuing operations and
diluted earnings per share from continuing operations as compared to the fourth quarter
of 2003 was due to:
•The increased demand for the company’s offerings associated with moderate
expansion of the economy, as well as the company’s continued market share gains
•Favorable impact of currency translation partly offset by related hedging activity
The following is an analysis of the external segment results.
Global Services revenue increased 10.1 percent (5.7 percent adjusting for currency). SO
revenue increased 12 percent as each geography had year-to-year revenue growth. ITS
revenue increased 8 percent helped by continued growth in Business Continuity and
Recovery Services. BCS revenue increased 12 percent year-to-year, with double-digit
growth in both the Americas and Asia Pacific and high single-digit growth in EMEA.
The company achieved Global Services signings of $12.7 billion, including 13 signings
over $100 million.
The company’s Systems & Technology Group revenue grew 4.9 percent (1.3 percent
adjusting for currency). xSeries server revenue increased 25 percent year-to-year driven by
solid performance in both high-end and 1& 2 Way servers. The IBM Blade servers continued
their strong growth in the fourth quarter of 2004. pSeries revenue increased 15 percent
year-to-year in the fourth quarter, reflecting very strong client acceptance of the POWER5
systems technology. OEM grew 10 percent year-to-year in the fourth quarter driven by
improved yields in the 300 millimeter line where output grew 40 percent versus the
third quarter and Engineering & Technology Services business revenue grew at 61 per-
cent year-to-year. These increases were partially offset by lower zSeries server revenue of