IBM 2004 Annual Report Download - page 30
Download and view the complete annual report
Please find page 30 of the 2004 IBM annual report below. You can navigate through the pages in the report by either clicking on the pages listed below, or by using the keyword search tool below to find specific information within the annual report.-
 1
1 -
2
-
3
-
4
-
5
-
6
-
7
-
8
-
9
-
10
-
11
-
12
-
13
-
14
-
15
-
16
-
17
-
18
-
19
-
 20
20 -
 21
21 -
 22
22 -
 23
23 -
 24
24 -
 25
25 -
 26
26 -
 27
27 -
 28
28 -
 29
29 -
 30
30 -
 31
31 -
 32
32 -
 33
33 -
 34
34 -
 35
35 -
 36
36 -
 37
37 -
 38
38 -
 39
39 -
 40
40 -
41
-
42
-
43
-
44
-
45
-
46
-
47
-
48
-
49
-
50
-
51
-
52
-
53
-
54
-
55
-
56
-
57
-
58
-
59
-
60
-
61
-
62
-
63
-
64
-
65
-
66
-
67
-
68
-
69
-
70
-
71
-
72
-
73
-
74
-
75
-
76
-
77
-
78
-
79
-
80
-
81
-
82
-
83
-
84
-
85
-
86
-
87
-
88
-
89
-
90
-
91
-
92
-
93
-
94
-
95
-
96
-
97
-
98
-
99
-
100
 |
 |

MANAGEMENT DISCUSSION
International Business Machines Corporation and Subsidiary Companies
28
ibm annual report 2004
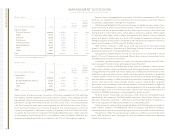
Software
Software revenue increased 9.4 percent (1.9 percent at constant currency) in 2003 versus
2002, driven by Middleware software products. The WebSphere family of software offer-
ings revenue increased 11.8 percent as clients continued to focus on the higher function
products that integrate Web-based applications, including advanced collaboration tech-
nology, on a user’s desktop. The lower-function WebSphere application server continued
to commoditize. Improved demand was also noted for Data Management DB2 database
software. Revenue from Tivoli products increased 12.0 percent as clients continue to real-
ize the on demand attributes of Tivoli products, enabling businesses to securely automate
many of their processes and gain operational efficiencies. Operating system software
revenue increased 6.2 percent due to the favorable impacts of currency movements.
Offsetting these increases were lower demand for DB2 tools, Lotus advanced collabora-
tion software, and Other middleware software. A new Lotus messaging platform became
generally available during the 2003 fourth quarter and helped to drive momentum in the
Lotus Notes family of products towards the end of 2003. Overall, the increase in total
Software revenue was mainly due to the acquisition of Rational in the first quarter of 2003.
When compared to the separately reported 2002 external revenue amounts for Rational,
its revenue increased approximately 6 percent in 2003.
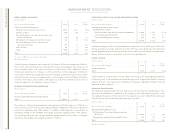
Global Financing
See pages 35 to 39 for prior year review of Global Financing.
Enterprise Investments
Revenue from Enterprise Investments increased 4.2 percent (down 5.1 percent at constant
currency) in 2003 versus 2002. The decline was attributable to demand for product life-
cycle management software in the European market, especially in the automotive and
aerospace industries.
The company’s gross profit margins remained relatively flat. Increases in margins for
Hardware of 0.7 point resulting from the ongoing benefits from the company’s integrated
supply chain initiatives and Software of 2.1 points resulting from favorable currency trans-
lation were offset by decreases in Global Services margins of 1.1 points driven primarily
by investment costs on the early stages of an SO contract and the company’s changing mix
of revenue toward BCS.
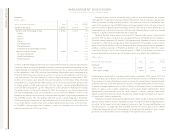
As discussed above, there were several charges in 2002 that impacted the year-to-
year expense comparison. These items contributed 2.8 points of the improvement in the
Total expense and other income-to-revenue ratio. The remaining improvement was prima-
rily due to the results of productivity and efficiency initiatives offset by an increase in retire-
ment-related plans cost.
The company’s effective tax rate increased from 29.1 percent in 2002 to 30.0 percent
in 2003. This increase was primarily due to a less favorable mix of geographic income and
the absence of the tax benefit associated with the Microelectronics actions taken in the
second quarter of 2002.
With regard to Assets, approximately $7 billion of the increase relates to the impact of
currency translation. The remaining increase primarily consists of an increase in Goodwill
of $2.8 billion associated with recent acquisitions, increased pension assets of $2.4 billion,
as well as strong cash performance. The increase in cash during 2003 was due to the com-
bination of stronger operating results and lower pension funding. The company reduced
non-Global Financing debt in 2003 as a result of strong cash flows from operations. Global
Financing debt also decreased, but the company’s Global Financing debt-to-equity ratio
remained flat at 6.9 to 1 and within the company’s target range.
The ratio of unguaranteed residual value as a percentage of the related original
amount financed declined 0.3 point to 3.6 percent at December 31, 2003, as compared
to December 31, 2002, due to an increase in the percentage of leases that contain bargain
purchase options.
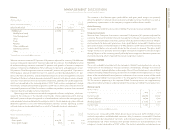
discontinued operations
On December 31, 2002, the company sold its HDD business to Hitachi for approximately
$2 billion. The majority of the cash was received with the remaining payment due in
December 2005. The HDD business was accounted for as a discontinued operation
whereby the results of operations and cash flows were removed from the company’s results
from continuing operations for all periods presented.
The company incurred a loss from discontinued operations of $1,755 million in 2002,
net of tax. The loss in 2002 was due to (amounts are net-of-tax):
•Loss on operational results ($620 million)
•Loss on sale ($382 million)
•Certain actions taken by the company in the second and fourth quarters of 2002
($508 million) related to the HDD business
•Inventory write-offs resulting from a strategic decision to cease reworking and selling
efforts for some of the older HDD products after the announcement of the divesti-
ture plans ($245 million)
Looking Forward
The following key drivers impacting the company’s business are discussed on page 17:
•Economic environment and corporate IT spending budgets
•Internal business transformation and efficiency initiatives
•Innovation initiatives
•Open standards
•Emerging business opportunities