IBM 2004 Annual Report Download - page 86
Download and view the complete annual report
Please find page 86 of the 2004 IBM annual report below. You can navigate through the pages in the report by either clicking on the pages listed below, or by using the keyword search tool below to find specific information within the annual report.-
 1
1 -
2
-
3
-
4
-
5
-
6
-
7
-
8
-
9
-
10
-
11
-
12
-
13
-
14
-
15
-
16
-
17
-
18
-
19
-
20
-
21
-
22
-
23
-
24
-
25
-
26
-
27
-
28
-
29
-
30
-
31
-
32
-
33
-
34
-
35
-
36
-
37
-
38
-
39
-
40
-
41
-
42
-
43
-
44
-
45
-
46
-
47
-
48
-
49
-
50
-
51
-
52
-
53
-
54
-
55
-
56
-
57
-
58
-
59
-
60
-
61
-
62
-
63
-
64
-
65
-
66
-
67
-
68
-
69
-
70
-
71
-
72
-
73
-
74
-
75
-
 76
76 -
 77
77 -
 78
78 -
 79
79 -
 80
80 -
 81
81 -
 82
82 -
 83
83 -
 84
84 -
 85
85 -
 86
86 -
 87
87 -
 88
88 -
 89
89 -
 90
90 -
 91
91 -
 92
92 -
 93
93 -
 94
94 -
 95
95 -
 96
96 -
97
-
98
-
99
-
100
 |
 |

NOTES TO CONSOLIDATED FINANCIAL STATEMENTS
International Business Machines Corporation and Subsidiary Companies
84
ibm annual report 2004
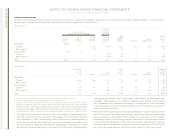
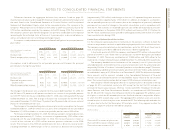
plan assets
The company’s pension plan weighted-average asset allocations at December 31, 2004
and 2003 and target allocation for 2005, by asset category, are as follows:
U.S. Plans
Plan Assets
2005
at December 31:
Target
Asset Category 2004 2003 Allocation
Equity securities*65.4% 67.5% 64.0%
Debt securities 31.6% 29.2% 32.0%
Real estate 3.0% 3.3% 4.0%
Total 100.0% 100.0% 100.0%
Non-U.S. Plans
Plan Assets
2005
at December 31:
Target
Asset Category 2004 2003 Allocation
Equity securities 58.4% 59.1% 58.5%
Debt securities 38.8% 38.5% 39.2%
Real estate 2.0% 1.9% 1.9%
Other 0.8% 0.5% 0.4%
Total 100.0% 100.0% 100.0%
*See discussion below regarding certain private market assets, and future funding commitments thereof, that are not
as liquid as the rest of the publicly traded securities.
The investment objectives of the PPP portfolio of assets (the Fund) are designed to gen-
erate returns that will enable the Fund to meet its future obligations. The precise amount
for which these obligations will be settled depends on future events, including the life
expectancy of the Plan’s members and salary inflation. The obligations are estimated using
actuarial assumptions, based on the current economic environment. The Fund’s investment
strategy balances the requirement to generate return, using higher-returning assets such
as equity securities, with the need to control risk in the Fund with less volatile assets, such
as fixed income securities. Risks include, among others, inflation, volatility in equity values
and changes in interest rates that could cause the Plans to become underfunded, thereby
increasing their dependence on contributions from the company. Within each asset class,
careful consideration is given to balancing the portfolio among industry sectors, geogra-
phies, interest rate sensitivity, dependence on economic growth, currency and other factors
that affect investment returns.
The assets are managed by professional investment firms as well as by investment
professionals who are employees of the company. They are bound by precise mandates
and are measured against specific benchmarks. Among managers, consideration is given,
among others, to balancing security concentration, issuer concentration, investment style
and reliance on particular active investment strategies. Market liquidity risks are tightly
controlled, with only a small percentage of the PPP portfolio invested in private market
assets consisting of private equities and private real estate investments, which are less liq-
uid than publicly traded securities. The PPP included private market assets comprising
approximately 10.1 percent and 10.5 percent of total assets at December 31, 2004 and
2003, respectively. The target allocation for private market assets in 2005 is 10.1 percent.
The Fund has $2,628 million in commitments for future private market investments to be
made over a number of years. These commitments are expected to be fulfilled from plan
assets. Derivatives are primarily used to hedge currency, adjust portfolio duration, and
reduce specific market risks.
Outside the U.S., the investment objectives are similar, subject to local regulations. In
some countries, a higher percentage allocation to fixed income securities is required. In
others, the responsibility for managing the investments typically lies with a board that may
include up to 50 percent of members elected by employees and retirees. This can result
in slight differences compared with the strategies described above. Generally, these non-
U.S. funds are not permitted to invest in illiquid assets, such as private equities, and their
use of derivatives is usually limited to passive currency hedging. During 2004, there was
no significant change in the investment strategies of these plans.
Equity securities include IBM common stock in the amounts of $1,376 million (3.1 per-
cent of total PPP plan assets at December 31, 2004) and $2,144 million (5.1 percent of total
PPP plan assets at December 31, 2003).
expected contributions
In 2005, the company estimates contributions to its non-U.S. plans to be an amount that is
equivalent to such contributions in 2004 ($1,085 million). The company could elect to con-
tribute more or less than the amount based on market conditions. The legally mandated
minimum contributions to the company’s non-U.S. plans is expected to be $361 million.
On January 19, 2005, the company elected to make a $1.7 billion contribution to the qual-
ified portion of PPP. Depending upon market conditions, the company may elect to further
contribute to the qualified portion of the PPP during 2005.