IBM 2004 Annual Report Download - page 38
Download and view the complete annual report
Please find page 38 of the 2004 IBM annual report below. You can navigate through the pages in the report by either clicking on the pages listed below, or by using the keyword search tool below to find specific information within the annual report.-
 1
1 -
2
-
3
-
4
-
5
-
6
-
7
-
8
-
9
-
10
-
11
-
12
-
13
-
14
-
15
-
16
-
17
-
18
-
19
-
20
-
21
-
22
-
23
-
24
-
25
-
26
-
27
-
 28
28 -
 29
29 -
 30
30 -
 31
31 -
 32
32 -
 33
33 -
 34
34 -
 35
35 -
 36
36 -
 37
37 -
 38
38 -
 39
39 -
 40
40 -
 41
41 -
 42
42 -
 43
43 -
 44
44 -
 45
45 -
 46
46 -
 47
47 -
 48
48 -
49
-
50
-
51
-
52
-
53
-
54
-
55
-
56
-
57
-
58
-
59
-
60
-
61
-
62
-
63
-
64
-
65
-
66
-
67
-
68
-
69
-
70
-
71
-
72
-
73
-
74
-
75
-
76
-
77
-
78
-
79
-
80
-
81
-
82
-
83
-
84
-
85
-
86
-
87
-
88
-
89
-
90
-
91
-
92
-
93
-
94
-
95
-
96
-
97
-
98
-
99
-
100
 |
 |

MANAGEMENT DISCUSSION
International Business Machines Corporation and Subsidiary Companies
36
ibm annual report 2004
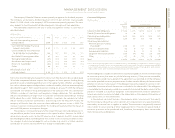
Global Financing gross profit dollars increased 3.2 percent and gross profit margin
increased 5.2 points in 2004 versus 2003. The increase in gross profit dollars was primarily
driven by cost of sales on remarketing equipment of $931 million in 2004 versus $1,168
million in 2003, a decrease of 20.2 percent and borrowing costs of $608 million in 2004
versus $678 million in 2003, a decrease of 10.3 percent related to volumes and the inter-
est rate environment during the year, partially offset by the decrease in revenue discussed
above. The increase in gross profit margin was driven by improved margins in financing
and equipment sales, and a mix change toward higher margin financing income and away
from lower margin equipment sales.
Global Financing gross profit dollars decreased 2.5 percent and gross profit margin
declined 1.2 points in 2003 versus 2002. The decrease in gross profit dollars was primarily
driven by declining interest rates and lower average asset base discussed above, partially
offset by improved financing margins. The decrease in gross profit margin was driven by
a mix change toward lower margin remarketing sales and away from financing income,
partially offset by lower borrowing costs related to the interest rate environment during
the year.
Global Financing pre-tax income increased 26.4 percent in 2004 versus 2003, com-
pared with an increase of 23.8 percent in pre-tax income in 2003 versus 2002. The increase
in 2004 was driven by a decrease of $101 million in bad debt expense, a decrease of
$23 million in selling, general and administration expenses, a decrease of $100 million in
other charges primarily driven by income from internal sales, and the increase in gross
profit of $74 million discussed above. The decrease in bad debt expense is reflective of
the improved general economic environment, improved credit quality of the portfolio, and
the declining size of the receivables portfolio. (Also see page 37 for an additional discussion
of IBM Global Financing Allowance for Doubtful Accounts.) The increase in 2003 versus
2002 was driven by a decrease in bad debt expense partially offset by the decrease in
gross profit discussed above. The decrease in bad debt expense is reflective of the improved
general economic environment and reduced exposure in specific sectors, particularly the
Communications sector.
The increases in return on equity from 2003 to 2004 and from 2002 to 2003 were also
due to higher earnings.
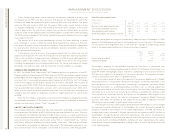
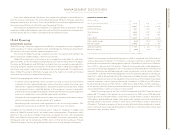
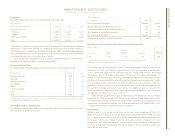
financial condition
Balance Sheet
(Dollars in millions)
AT DECEMBER 31: 2004 2003
Cash $««««««850 $««««««813
Net investment in sales-type leases 11,141 11,969
Equipment under operating leases:
External customers 1,817 1,707
Internal customers (a) (b) 1,906 1,873
Customer loans 9,889 10,413
Total customer financing assets 24,753 25,962
Commercial financing receivables 5,710 5,835
Intercompany financing receivables (a) (b) 2,172 1,999
Other receivables 223 270
Other assets 881 1,037
Total financing assets $«34,589 $«35,916
Intercompany payables (a) $«««6,394 $«««6,754
Debt (c) 22,320 23,264
Other liabilities 2,620 2,546
Total financing liabilities 31,334 32,564
Total financing equity 3,255 3,352
Total financing liabilities and equity $«34,589 $«35,916
(a) Amounts eliminated for purposes of IBM’s consolidated results and therefore do not appear on pages 42 and 43.
(b) These assets, along with all other financing assets in this table, are leveraged using Global Financing debt.
(c) Global Financing debt includes debt of the company and of the Global Financing units that support the Global
Financing business.
Sources and Uses of Funds
The primary use of funds in Global Financing is to originate customer and commercial
financing assets. Customer financing assets for end users consist primarily of IBM hardware,
software and services, but also include non-IBM equipment, software and services to meet
IBM clients’ total solutions requirements. Customer financing assets are primarily sales-
type, direct financing, and operating leases for equipment as well as loans for hardware,
software and services with terms generally for two to five years. Customer financing also
includes internal activity as described on page 35.
Commercial financing originations arise primarily from inventory and accounts receiv-
able financing for dealers and remarketers of IBM and non-IBM products. Payment terms
for inventory financing generally range from 30 to 75 days. Payment terms for accounts
receivable financing generally range from 30 to 90 days.