IBM 2004 Annual Report Download - page 25
Download and view the complete annual report
Please find page 25 of the 2004 IBM annual report below. You can navigate through the pages in the report by either clicking on the pages listed below, or by using the keyword search tool below to find specific information within the annual report.-
 1
1 -
2
-
3
-
4
-
5
-
6
-
7
-
8
-
9
-
10
-
11
-
12
-
13
-
14
-
 15
15 -
 16
16 -
 17
17 -
 18
18 -
 19
19 -
 20
20 -
 21
21 -
 22
22 -
 23
23 -
 24
24 -
 25
25 -
 26
26 -
 27
27 -
 28
28 -
 29
29 -
 30
30 -
 31
31 -
 32
32 -
 33
33 -
 34
34 -
 35
35 -
36
-
37
-
38
-
39
-
40
-
41
-
42
-
43
-
44
-
45
-
46
-
47
-
48
-
49
-
50
-
51
-
52
-
53
-
54
-
55
-
56
-
57
-
58
-
59
-
60
-
61
-
62
-
63
-
64
-
65
-
66
-
67
-
68
-
69
-
70
-
71
-
72
-
73
-
74
-
75
-
76
-
77
-
78
-
79
-
80
-
81
-
82
-
83
-
84
-
85
-
86
-
87
-
88
-
89
-
90
-
91
-
92
-
93
-
94
-
95
-
96
-
97
-
98
-
99
-
100
 |
 |

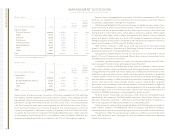
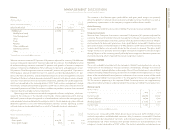
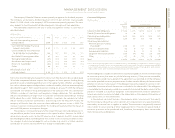
Software
(Dollars in millions)
Yr. to Yr.
FOR THE YEAR ENDED DECEMBER 31: 2004 2003*Change
Software Revenue: $«15,094 $«14,311 5.5%
Middleware $«11,963 $«11,240 6.4%
WebSphere family 14.2
Data Management 6.6
Lotus 2.7
Tivoli 15.0
Rational 15.5
Other middleware 1.8
Operating systems 2,474 2,452 0.9
Other 657 619 6.1
*Reclassified to conform with 2004 presentation.
Software revenue increased 5.5 percent (0.6 percent adjusted for currency). Middleware
revenue increased 6.4 percent (1.5 percent adjusted for currency). The WebSphere family
of software offerings revenue increased 14 percent with growth in business integration
software (14 percent), WebSphere Portal software (12 percent) and application servers
(20 percent). Data Management revenue increased 7 percent with growth of 12 percent in
DB2 Database software on both the host (13 percent) and distributed platforms (11 per-
cent), DB2 Tools (8 percent), and distributed enterprise content management software
(23 percent). Rational software revenue increased (15 percent) with growth across all prod-
uct areas. Tivoli software revenue increased (15 percent), aided by the Candle acquisition,
which was completed in the second quarter of 2004. Tivoli systems management, storage
and security software all had revenue growth in 2004 versus 2003. Lotus software revenue
increased 3 percent and Other Foundation middleware products revenue also increased
2 percent due to favorable currency movements.
Operating system software increased due to growth in xSeries and pSeries, which cor-
relates to the increases in the related server brands. zSeries operating system revenue
declined 1 percent despite the growth in related hardware volumes due to ongoing soft-
ware price performance delivered to enterprise clients. iSeries operating system software
declined 6 percent in line with related hardware volumes. Overall, operating systems
software revenue increased primarily as a result of favorable currency movements.
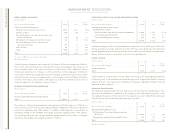
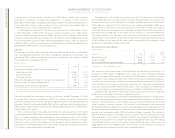
(Dollars in millions)
Yr. to Yr.
FOR THE YEAR ENDED DECEMBER 31: 2004 2003 Change
Software:
Gross profit $«13,175 $«12,384 6.4%
Gross profit margin 87.3% 86.5% 0.8pts.
The increase in the Software gross profit dollars and gross profit margin was primarily
driven by growth in software revenue due to favorable currency movements, as well as
productivity improvements in the company’s support and distribution models.
Global Financing
See pages 35 and 36 for a discussion of Global Financing’s revenue and gross profit.
Enterprise Investments
Revenue from Enterprise Investments increased 10.8 percent (4.2 percent adjusted for
currency). Revenue for product life-cycle management software increased primarily in the
automotive and aerospace industries, partially offset by lower hardware revenue (48 per-
cent), primarily for document processors. Gross profit dollars increased 12.4 percent and
gross profit margins increased 0.6 points to 44.2 percent in 2004 versus 2003. The increase
in gross profit dollars was primarily driven by the increase in revenue. The gross profit
margin increase was primarily driven by higher life-cycle management software margins
driving 0.8 points of the increase, partially offset by lower margins on document processors
due to discounting, which impacted the overall margin by 0.2 points.
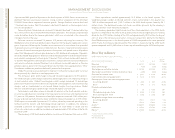
financial position
Dynamics
The assets and debt associated with the company’s Global Financing business are a sig-
nificant part of the company’s financial condition. Accordingly, although the financial
position amounts appearing below and on pages 24 and 25 are the company’s consolidated
amounts including Global Financing, to the extent the Global Financing business is a major
driver of the consolidated financial position, reference in the narrative section will be made
to the separate Global Financing section in this Management Discussion on pages 35 to
39. The amounts appearing in the separate Global Financing section are supplementary
data presented to facilitate an understanding of the company’s Global Financing business.
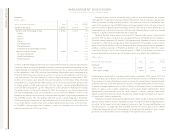
Working Capital
(Dollars in millions)
AT DECEMBER 31: 2004 2003*
Current assets $«46,970 $«44,662
Current liabilities 39,798 37,623
Working capital $«««7,172 $«««7,039
Current ratio 1.18:1 1.19:1
*Reclassified to conform with 2004 presentation.
MANAGEMENT DISCUSSION
International Business Machines Corporation and Subsidiary Companies
23
ibm annual report 2004
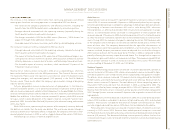
Current assets increased $2,308 million driven by an increase of $2,923 million in Cash
and cash equivalents and Marketable securities. Also, Inventories increased $374 million
primarily driven by new product transitions and increased capacity in the 300 millimeter
semiconductor fab. These increases were partially offset by an overall decrease in the
company’s current receivables of $787 million. The current receivables net decrease was