ADT 2003 Annual Report Download - page 94
Download and view the complete annual report
Please find page 94 of the 2003 ADT annual report below. You can navigate through the pages in the report by either clicking on the pages listed below, or by using the keyword search tool below to find specific information within the annual report.-
 1
1 -
2
-
3
-
4
-
5
-
6
-
7
-
8
-
9
-
10
-
11
-
12
-
13
-
14
-
15
-
16
-
17
-
18
-
19
-
20
-
21
-
22
-
23
-
24
-
25
-
26
-
27
-
28
-
29
-
30
-
31
-
32
-
33
-
34
-
35
-
36
-
37
-
38
-
39
-
40
-
41
-
42
-
43
-
44
-
45
-
46
-
47
-
48
-
49
-
50
-
51
-
52
-
53
-
54
-
55
-
56
-
57
-
58
-
59
-
60
-
61
-
62
-
63
-
64
-
65
-
66
-
67
-
68
-
69
-
70
-
71
-
72
-
73
-
74
-
75
-
76
-
77
-
78
-
79
-
80
-
81
-
82
-
83
-
 84
84 -
 85
85 -
 86
86 -
 87
87 -
 88
88 -
 89
89 -
 90
90 -
 91
91 -
 92
92 -
 93
93 -
 94
94 -
 95
95 -
 96
96 -
 97
97 -
 98
98 -
 99
99 -
 100
100 -
 101
101 -
 102
102 -
 103
103 -
 104
104 -
105
-
106
-
107
-
108
-
109
-
110
-
111
-
112
-
113
-
114
-
115
-
116
-
117
-
118
-
119
-
120
-
121
-
122
-
123
-
124
-
125
-
126
-
127
-
128
-
129
-
130
-
131
-
132
 |
 |

92
included consideration of (i) the stage of completion of each
of the projects, (ii) the technological feasibility of each of the
projects, (iii) whether the projects had an alternative future use,
and (iv) the estimated future residual cash flows that could be
generated from the various projects and technologies over their
respective projected economic lives.
As of the Mallinckrodt acquisition date, there were several
projects under development at different stages of completion.
The primary basis for determining the technological feasibility
of these projects was obtaining Food and Drug Administration
(“FDA”) approval. As of the acquisition date, none of the IPR&D
projects had received FDA approval. In assessing the techno-
logical feasibility of a project, consideration was also given to
the level of complexity and future technological hurdles that
each project had to overcome prior to being submitted to the
FDA for approval. As of the acquisition date, none of the
IPR&D projects were considered to be technologically feasible
or to have any alternative future use.
Future residual cash flows that could be generated from
each of the projects were determined based upon an estimate of
future revenue and expected profitability of the various products
and technologies involved. These projected cash flows were
then discounted to their present values taking into account the
estimate of future expenses that would be necessary to bring
the projects to completion. The discount rates include a rate of
return, which accounts for the time value of money, as well as
risk factors that reflect the economic risk that the cash flows
projected may not be realized. The cash flows were discounted
at discount rates ranging from 14% to 25% per annum, depend-
ing on the project’s stage of completion and the type of FDA
approval needed. This discounted cash flow methodology for
the various projects included in the purchased IPR&D resulted
in a total valuation of $184.3 million. Although work on the
projects related to the IPR&D continued after the acquisition,
the amount of purchase price allocated to IPR&D was written
off because the projects underlying the IPR&D that was being
developed were not considered technologically feasible as of the
acquisition date. As of September 30, 2003, approximately 53%
of the IPR&D projects have been successfully completed and
approximately 25% of the projects have been discontinued or
are currently inactive. The remainder are in various stages of
completion. There are currently no expected material variations
between projected results from the projects versus those at the
time of the acquisition.
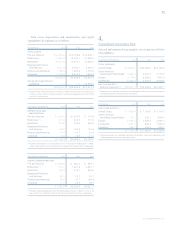
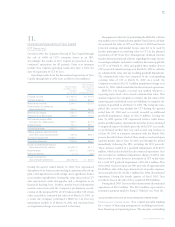
8.
Other (Expense) Income, Net
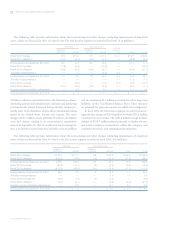
Other (expense) income, net is as follows ($ in millions):
YEAR ENDED SEPTEMBER 30, 2003 2002 2001
Income (loss) from early
retirement of debt $«««24.1 $«««30.6 $««(26.3)
Loss on retirement of debt (151.8) ——
Loss on investments (87.1) (270.8) (133.8)
Equity investee guarantee (8.6) ——
Net gain on sale
of businesses —23.6 410.4
$(223.4) $(216.6) $«250.3
Tyco has repurchased some debt prior to scheduled maturities.
In fiscal 2003, the Company recorded other income from the
early retirement of debt totaling $24.1 million, as compared to
$30.6 million in fiscal 2002, and a loss from the early retirement
of debt totaling $26.3 million for fiscal 2001.
During fiscal 2003, the Company repurchased all of its
6.25% Dealer Remarketable Securities (“Drs.”) due 2013. The
total Dollar Price paid was $902 million based upon the $750
million par value of the Drs. The portion in excess of par of
$151.8 million was recorded as a loss on retirement of debt.
During fiscal 2003, the Company recognized a charge of
$87.1 million relating to the write down of various investments
accounted for under both the cost and equity methods, of
which $81.3 million was recorded, when it became evident that
the declines in the fair value of the investments were other than
temporary, primarily due to the continuing depressed economic
conditions specifically within the telecommunications industry.
Included within the $81.3 million is $75.6 million recorded
during the quarter ended March 31, 2003 (see Note 31). The
remaining $5.8 million charge adjusted a portion of the
remaining portfolio to its fair value based upon estimates
received in conjunction with our decision to sell such invest-
ments. During fiscal 2002, the Company recognized a $270.8
million loss on various investments, primarily related to its
investments in FLAG Telecom Holdings Ltd. (“FLAG”) when it
became evident that the declines in the fair value of FLAG and
other investments were other than temporary. During fiscal
2001, the Company recognized a $133.8 million loss on various
investments primarily related to its investment in 360networks
when it became evident that the declines in the fair value of the
investments were other than temporary.
TYCO INTERNATIONAL LTD.
Notes to Consolidated Financial Statements