ADT 2003 Annual Report Download - page 37
Download and view the complete annual report
Please find page 37 of the 2003 ADT annual report below. You can navigate through the pages in the report by either clicking on the pages listed below, or by using the keyword search tool below to find specific information within the annual report.-
 1
1 -
2
-
3
-
4
-
5
-
6
-
7
-
8
-
9
-
10
-
11
-
12
-
13
-
14
-
15
-
16
-
17
-
18
-
19
-
20
-
21
-
22
-
23
-
24
-
25
-
26
-
 27
27 -
 28
28 -
 29
29 -
 30
30 -
 31
31 -
 32
32 -
 33
33 -
 34
34 -
 35
35 -
 36
36 -
 37
37 -
 38
38 -
 39
39 -
 40
40 -
 41
41 -
 42
42 -
 43
43 -
 44
44 -
 45
45 -
 46
46 -
 47
47 -
48
-
49
-
50
-
51
-
52
-
53
-
54
-
55
-
56
-
57
-
58
-
59
-
60
-
61
-
62
-
63
-
64
-
65
-
66
-
67
-
68
-
69
-
70
-
71
-
72
-
73
-
74
-
75
-
76
-
77
-
78
-
79
-
80
-
81
-
82
-
83
-
84
-
85
-
86
-
87
-
88
-
89
-
90
-
91
-
92
-
93
-
94
-
95
-
96
-
97
-
98
-
99
-
100
-
101
-
102
-
103
-
104
-
105
-
106
-
107
-
108
-
109
-
110
-
111
-
112
-
113
-
114
-
115
-
116
-
117
-
118
-
119
-
120
-
121
-
122
-
123
-
124
-
125
-
126
-
127
-
128
-
129
-
130
-
131
-
132
 |
 |

35
overcapacity in the market and resulting lack of demand for
new system construction. In the fourth fiscal quarter of 2002,
management decided to focus the business for the foreseeable
future on maintenance revenues and capacity sales on the TGN,
to discontinue future additions to the TGN, and limit con-
struction activities to small projects that were cash flow positive
with at least breakeven earnings. As a result of this strategy,
management devised a plan to significantly downsize the man-
ufacturing footprint, decrease project management staffing,
reduce the research and development function and minimize
staffing and expense in all other administrative areas of the
business to decrease cash outflows and losses to the maximum
extent possible. This plan was carefully crafted to ensure that
both the technical and construction competencies of the business
would be preserved in the event industry conditions improve.
Operating income and margins in fiscal 2001 include
restructuring and other charges of $383.8 million primarily
related to the closure of facilities within the communications,
computer and consumer electronics industries in response to
the severe downturn experienced. Included within the $383.8
million are inventory write downs of $74.1 million and charges
of $51.7 million for the write-up of inventory under purchase
accounting, both of which are included in cost of sales.
Operating income and margins for fiscal 2001 also include
charges of $98.5 million for the impairment of property, plant
and equipment associated with the facility closures.
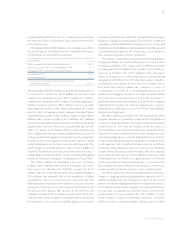
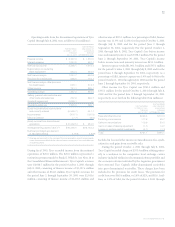
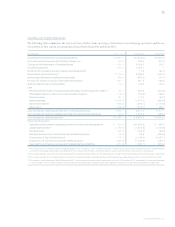
Healthcare The following table sets forth net revenues and
operating income and margins for the Healthcare segment
($ in millions):
FISCAL 2003 FISCAL 2002 FISCAL 2001
Revenue from
product sales $8,496.0 $7,828.4 $7,001.1
Service revenue 75.9 70.7 64.2
Net revenues $8,571.9 $7,899.1 $7,065.3
Operating income $2,127.1 $1,846.8 $1,509.3
Operating margins 24.8% 23.4% 21.4%
Net revenues for the Healthcare segment increased 8.5% in fiscal
2003 over fiscal 2002, including an 8.5% increase in product
revenue and a 7.4% increase in service revenue. The increase in
net revenues resulted primarily from organic growth and favor-
able foreign currency exchange rates and, to a lesser extent,
acquisitions, net of divestitures. Organic growth was due to the
following: increases in the surgical sector concurrent with the
award of a major contract and continued organic growth
within certain surgical stapling lines; increases in the medical
sector resulting from the award of a significant wound care
contract, coupled with the exit of a major competitor from the
traditional wound care business, new product launches and
higher demand in the ultrasound market; increases in pharma-
ceuticals and imaging due to higher volumes and increased
market share; and strong sales within the respiratory division.
These sales increases were partially offset by a decrease in the
diaper product segment of the Retail business largely resulting
from the adverse impact of the industry-wide down-count
issues, and a decline in the International division due to lower
sales in continental Europe and Latin America. The increase in
net revenues also resulted from favorable changes in foreign
exchange rates ($268.2 million) and incremental revenues gener-
ated from the acquisition of Paragon Trade Brands (“Paragon”)
in January 2002 ($123.8 million calculated in the manner
described above in “Overview”), slightly offset by a decline in
revenues ($48.1 million) related to the divestiture of Surgical
Dynamics, Inc. in July 2002.
The 15.2% increase in operating income and increase in
margins in fiscal 2003 compared to fiscal 2002 were due prima-
rily to favorable margin impact as a result of higher sales and
favorable manufacturing variances as a result of increased
production volumes, a shift to a more favorable product mix,
and cost savings as a result of the closure of certain Paragon
facilities, back office consolidations and our continued focus
on optimizing operating expenses. Slightly offsetting the effect
of those items were increased legal fees, insurance and pension
expense, and higher sales and marketing expense as a result of
program development aimed at supporting organic growth ini-
tiatives. Also contributing to the increase in operating income
and margins were favorable fluctuations in foreign currency
exchange rates and the impact of acquisitions and divestitures.
During fiscal 2003, we recorded net credits totaling $3.3 mil-
lion. Included within the total credits of $3.3 million are charges
of $11.7 million related to asset reserves for inventory and charges
of $0.7 million for adjustments to accrual balances related to
workers’ compensation, which were changes in estimates
recorded in connection with the Company’s intensified internal
audits, detailed controls and operating reviews and as a result
of applying management’s judgments and estimates. Also
included within the $3.3 million are restructuring credits of
$9.2 million, of which $0.2 million is included in cost of sales,
due to costs being less than anticipated and a credit of $6.5 mil-
lion included in selling, general and administrative expenses
related to an insurance reimbursement for certain legal fees
associated with product liability cases. The restructuring cred-
its of $9.2 million include credits of $4.7 million which were
also changes in estimates recorded during the quarter ended
March 31, 2003.
TYCO INTERNATIONAL LTD.