ADT 2003 Annual Report Download - page 47
Download and view the complete annual report
Please find page 47 of the 2003 ADT annual report below. You can navigate through the pages in the report by either clicking on the pages listed below, or by using the keyword search tool below to find specific information within the annual report.-
 1
1 -
2
-
3
-
4
-
5
-
6
-
7
-
8
-
9
-
10
-
11
-
12
-
13
-
14
-
15
-
16
-
17
-
18
-
19
-
20
-
21
-
22
-
23
-
24
-
25
-
26
-
27
-
28
-
29
-
30
-
31
-
32
-
33
-
34
-
35
-
36
-
 37
37 -
 38
38 -
 39
39 -
 40
40 -
 41
41 -
 42
42 -
 43
43 -
 44
44 -
 45
45 -
 46
46 -
 47
47 -
 48
48 -
 49
49 -
 50
50 -
 51
51 -
 52
52 -
 53
53 -
 54
54 -
 55
55 -
 56
56 -
 57
57 -
58
-
59
-
60
-
61
-
62
-
63
-
64
-
65
-
66
-
67
-
68
-
69
-
70
-
71
-
72
-
73
-
74
-
75
-
76
-
77
-
78
-
79
-
80
-
81
-
82
-
83
-
84
-
85
-
86
-
87
-
88
-
89
-
90
-
91
-
92
-
93
-
94
-
95
-
96
-
97
-
98
-
99
-
100
-
101
-
102
-
103
-
104
-
105
-
106
-
107
-
108
-
109
-
110
-
111
-
112
-
113
-
114
-
115
-
116
-
117
-
118
-
119
-
120
-
121
-
122
-
123
-
124
-
125
-
126
-
127
-
128
-
129
-
130
-
131
-
132
 |
 |

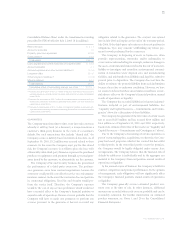
45
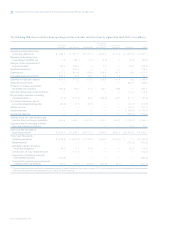
(1) This amount is the sum of depreciation of tangible property ($1,471.9 million, $1,464.1 million and $1,242.7 million in fiscal 2003, fiscal 2002 and fiscal 2001, respectively) and
amortization of intangible assets other than goodwill ($725.0 million, $620.9 million and $399.3 million in fiscal 2003, fiscal 2002 and fiscal 2001, respectively).
(2) This amount includes cash paid out for restructuring and other charges of $503.3 million, $517.5 million and $215.5 million for fiscal 2003, fiscal 2002 and fiscal 2001, respectively.
(3) This amount includes $151.8 million related to a loss on the retirement of debt associated with the 6.25% Dealer Remarketable Securities (“Drs.”) due 2013 for fiscal 2003.
(4) This amount is net of proceeds of $29.5 million and $427.7 million received in sale-leaseback transactions for fiscal 2002 and fiscal 2001, respectively. It is also net of proceeds
of $123.8 million, $166.2 million and $62.0 million received in sale/disposition of property, plant and equipment in fiscal 2003, fiscal 2002 and fiscal 2001, respectively.
TYCO INTERNATIONAL LTD.
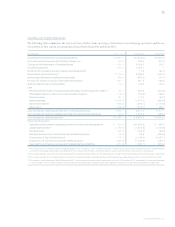
Liquidity and Capital Resources
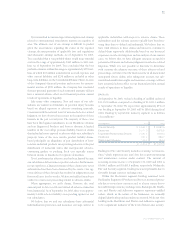
The following table summarizes the sources of our cash flow from operating activities from our continuing operations and the use
of a portion of that cash in our operations in fiscal 2003, fiscal 2002 and fiscal 2001.
($ IN MILLIONS) FISCAL 2003 FISCAL 2002 FISCAL 2001
Operating income (loss) from continuing operations $«3,067.0 $(1,452.4) $«5,616.4
Non-cash restructuring and other (credits) charges, net (45.9) 796.5 312.0
Charges for the impairment of long-lived assets 824.9 3,309.5 120.1
Goodwill impairment 278.4 1,343.7 —
Write off of purchased in-process research and development —17.8 184.3
Depreciation and amortization (1) 2,196.9 2,085.0 1,642.0
Net increase (decrease) in deferred income taxes 348.9 (585.2) 107.3
Provision for losses on accounts receivable and inventory 581.1 501.6 598.2
Debt and refinancing cost amortization 116.4 194.0 108.4
Less:
Net decrease (increase) in working capital, excluding current maturities of debt (2) 45.1 640.2 (944.5)
(Decrease) increase in sale of accounts receivable programs (119.0) (56.4) 490.6
Interest income 107.2 117.3 128.3
Interest expense (1,148.0) (1,077.0) (904.8)
Income tax expense (764.5) (208.1) (1,172.3)
Other, net (3) (142.4) (215.1) 425.1
Cash provided by operating activities from continuing operations 5,346.1 5,411.4 6,711.1
Cash provided by (used in) operating activities from discontinued operations 20.0 1,462.9 (260.2)
Cash provided by operating activities $«5,366.1 $«6,874.3 $«6,450.9
Other Cash Flow Items:
Cash (provided by) used in operating activities from discontinued operations $«««««(20.0) $(1,462.9) $«÷«260.2
Capital expenditures (4) (1,169.6) (1,678.8) (1,773.4)
Dividends paid (100.9) (100.3) (90.0)
Decrease (increase in) in sale of accounts receivable programs 119.0 56.4 (490.6)
Construction of Tyco Global Network (112.7) (1,146.0) (2,247.7)
Acquisition of customer accounts (ADT dealer program) (596.8) (1,139.3) (798.1)
Cash paid for purchase accounting and holdback/earn-out liabilities (271.8) (624.1) (878.7)