ADT 2003 Annual Report Download - page 64
Download and view the complete annual report
Please find page 64 of the 2003 ADT annual report below. You can navigate through the pages in the report by either clicking on the pages listed below, or by using the keyword search tool below to find specific information within the annual report.-
 1
1 -
2
-
3
-
4
-
5
-
6
-
7
-
8
-
9
-
10
-
11
-
12
-
13
-
14
-
15
-
16
-
17
-
18
-
19
-
20
-
21
-
22
-
23
-
24
-
25
-
26
-
27
-
28
-
29
-
30
-
31
-
32
-
33
-
34
-
35
-
36
-
37
-
38
-
39
-
40
-
41
-
42
-
43
-
44
-
45
-
46
-
47
-
48
-
49
-
50
-
51
-
52
-
53
-
 54
54 -
 55
55 -
 56
56 -
 57
57 -
 58
58 -
 59
59 -
 60
60 -
 61
61 -
 62
62 -
 63
63 -
 64
64 -
 65
65 -
 66
66 -
 67
67 -
 68
68 -
 69
69 -
 70
70 -
 71
71 -
 72
72 -
 73
73 -
 74
74 -
75
-
76
-
77
-
78
-
79
-
80
-
81
-
82
-
83
-
84
-
85
-
86
-
87
-
88
-
89
-
90
-
91
-
92
-
93
-
94
-
95
-
96
-
97
-
98
-
99
-
100
-
101
-
102
-
103
-
104
-
105
-
106
-
107
-
108
-
109
-
110
-
111
-
112
-
113
-
114
-
115
-
116
-
117
-
118
-
119
-
120
-
121
-
122
-
123
-
124
-
125
-
126
-
127
-
128
-
129
-
130
-
131
-
132
 |
 |

62
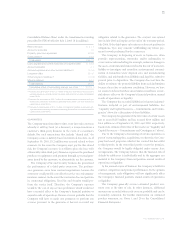
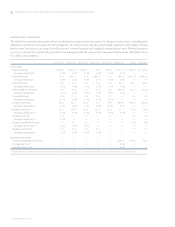
INTEREST RATE SENSITIVITY
The table below provides information about our financial instruments that are sensitive to changes in interest rates, including debt
obligations and interest rate swaps. For debt obligations, the table presents cash flows of principal repayment and weighted-average
interest rates. For interest rate swaps, the table presents notional amounts and weighted-average interest rates. Notional amounts
are used to calculate the contractual payments to be exchanged under the contract. The amounts included in the table below are in
U.S. dollars ($ in millions).
FISCAL 2004 FISCAL 2005 FISCAL 2006 FISCAL 2007 FISCAL 2008 THEREAFTER TOTAL FAIR VALUE
TOTAL DEBT:
Fixed rate (US$)2,620.6 1,591.9 3,922.7 2.0 106.6 9,211.0 17,454.8 18,145.0
Average interest rate 0.3% 6.2% 5.9% 4.9% 6.5% 5.2% — —
Fixed rate (Euro) 12.5 578.7 5.4 688.0 1.6 785.6 2,071.8 2,068.2
Average interest rate 5.5% 4.4% 2.4% 6.1% 4.2% 5.5% — —
Fixed rate (Yen) 3.9 0.4 0.4 0.4 0.4 53.6 59.1 59.1
Average interest rate 2.2% 1.8% 2.1% 2.1% 2.1% 5.0% — —
Fixed rate (British Pound) 0.3 0.8 0.1 0.2 0.2 762.4 764.0 764.3
Average interest rate 4.9% 4.2% 5.0% 5.0% 5.0% 6.6% — —
Fixed rate (Other) 2.6 1.4 1.5 0.3 0.1 — 5.9 5.9
Average interest rate 4.7% 2.8% 1.3% 4.5% 4.5% — — —
Variable rate (US$)53.0 74.3 8.4 0.7 0.8 392.6 529.8 529.8
Average interest rate (1) 2.9% 0.2% 1.3% 2.0% 2.0% 8.1% — —
Variable rate (Euro) 19.1 10.8 10.4 12.3 12.9 11.1 76.6 76.6
Average interest rate (1) 3.3% 3.3% 3.4% 3.4% 3.5% 3.3% — —
Variable rate (Yen) 0.5—————0.50.5
Average interest rate (1) 1.4% ———————
Variable rate (British Pound) 0.7 0.1 0.1 — — — 0.9 0.9
Average interest rate (1) 4.4% 2.5% 2.5% —————
Variable rate (Other) 5.2 0.2 0.2 0.1 — — 5.7 5.7
Average interest rate (1) 1.6% 5.3% 5.3% 5.3% ————
INTEREST RATE SWAP:
Fixed to variable (British Pound) —————328.4 328.4 20.9
Average pay rate (1) —————2.6% — —
Average receive rate —————6.5% — —
(1) Weighted-average variable interest rates are based on applicable rates at September 30, 2003 per the terms of the contracts of the related financial instruments.
TYCO INTERNATIONAL LTD.
Management’s Discussion and Analysis of Financial Condition and Results of Operations