ADT 2003 Annual Report Download - page 118
Download and view the complete annual report
Please find page 118 of the 2003 ADT annual report below. You can navigate through the pages in the report by either clicking on the pages listed below, or by using the keyword search tool below to find specific information within the annual report.-
 1
1 -
2
-
3
-
4
-
5
-
6
-
7
-
8
-
9
-
10
-
11
-
12
-
13
-
14
-
15
-
16
-
17
-
18
-
19
-
20
-
21
-
22
-
23
-
24
-
25
-
26
-
27
-
28
-
29
-
30
-
31
-
32
-
33
-
34
-
35
-
36
-
37
-
38
-
39
-
40
-
41
-
42
-
43
-
44
-
45
-
46
-
47
-
48
-
49
-
50
-
51
-
52
-
53
-
54
-
55
-
56
-
57
-
58
-
59
-
60
-
61
-
62
-
63
-
64
-
65
-
66
-
67
-
68
-
69
-
70
-
71
-
72
-
73
-
74
-
75
-
76
-
77
-
78
-
79
-
80
-
81
-
82
-
83
-
84
-
85
-
86
-
87
-
88
-
89
-
90
-
91
-
92
-
93
-
94
-
95
-
96
-
97
-
98
-
99
-
100
-
101
-
102
-
103
-
104
-
105
-
106
-
107
-
 108
108 -
 109
109 -
 110
110 -
 111
111 -
 112
112 -
 113
113 -
 114
114 -
 115
115 -
 116
116 -
 117
117 -
 118
118 -
 119
119 -
 120
120 -
 121
121 -
 122
122 -
 123
123 -
 124
124 -
 125
125 -
 126
126 -
 127
127 -
 128
128 -
129
-
130
-
131
-
132
 |
 |

116
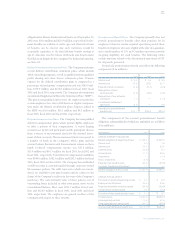
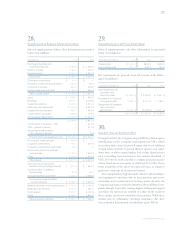
As discussed in Note 12, the Company has three synthetic
lease programs utilized, to some extent, by all of the Company’s
segments to finance capital expenditures for manufacturing
machinery and equipment and for ships used by Tyco
Submarine Telecommunications. During fiscal 2003, the
Company restructured one of the synthetic leases to meet the
requirements of FIN 46 for operating lease accounting and
reclassified the remaining two leases as capital leases. In addition,
the Company evaluated other investments and concluded that
four joint ventures that were previously accounted for under
the equity method of accounting within Tyco Infrastructure
Services, in which we own a minority interest, meet the consol-
idation criteria set forth in FIN 46. Accordingly, these ventures
have been consolidated onto the Company’s balance sheet. The
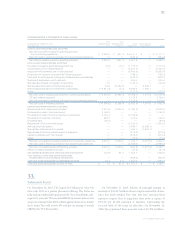
following table presents balance sheet information for the VIE’s
that were included within the Company’s Consolidated Balance
Sheet under the transitional accounting prescribed by FIN 46
effective July 1, 2003 ($ in millions).
Restricted cash $««21.7
Accounts receivable 7.5
Property, plant and equipment 433.8
Other assets (1) 28.2
Total assets 491.2
Loans payable and current maturities of long-term debt ««10.6
Accounts payable 2.1
Accrued expenses and other current liabilities (2) (31.6)
Long-term debt 551.6
Other long-term liabilities (3) (12.8)
Minority interest 46.4
Total liabilities 566.3
Cumulative effect of accounting change, net of tax $«(75.1)
(1) Includes the elimination of $1 6 . 2 million of equity investments related to joint
ventures previously recorded under the equity method which are now consolidated
under FIN 46.
(2) Includes the elimination of $32.7 million of accrued expenses associated with
synthetic leases previously recorded as operating leases which are now recorded as
capital leases under FIN 46.
(3) Includes the elimination of $1 4 . 7 million of long-term liabilities associated with
synthetic leases previously recorded as operating leases which are now recorded as
capital leases under FIN 46.
TYCO INTERNATIONAL LTD.
Notes to Consolidated Financial Statements
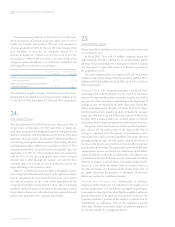
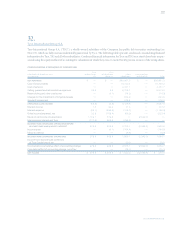
31.
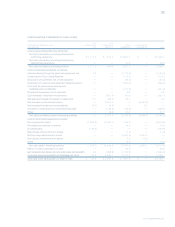
Summarized Quarterly Financial Data (Unaudited)
Summarized quarterly financial data for the year ended September 30, 2003 ($ in millions, except per share data):
YEAR ENDED SEPTEMBER 30, 2003 1ST QTR. (1) 2ND QTR. (2) 3RD QTR. (3) 4TH QTR. (4)
Net revenues $8,927.4 $8,988.5 $9,412.6 $9,472.8
Gross profit 3,195.4 3,133.0 3,398.9 3,182.1
Income (loss) from continuing operations 565.9 124.3 566.5 (222.0)
Net income (loss) 585.9 124.3 566.5 (297.1)
BASIC INCOME (LOSS) PER COMMON SHARE:
Income (loss) from continuing operations 0.28 0.06 0.28 (0.11)
Income (loss) per common share 0.29 0.06 0.28 (0.15)
DILUTED INCOME (LOSS) PER COMMON SHARE:
Income (loss) from continuing operations 0.28 0.06 0.27 (0.11)
Income (loss) per common share 0.29 0.06 0.27 (0.15)
(1) Includes net restructuring credits of $3.7 million, of which credits of $0.2 million are
included in cost of sales, and charges of $55.1 million which are included in selling,
general and administrative expenses. Also includes other income of $1.4 million
from the early retirement of debt. Net income also includes income from discontinued
operations of $20.0 million, net of tax.
(2) Includes charges recorded for changes in estimates of $388.7 million which arose
from the Company’s intensified internal audits and detailed controls and operating
reviews (see Changes in Estimates Recorded During the Quarter Ended March 31,
2003 below) and a charge for the impairment of intangible assets of $77.0 million.
In addition, includes a charge of $91.5 million for a retroactive, incremental premium
on prior period directors and officers insurance, which is included in selling, general
and administrative expenses. In addition, includes other income of $22.7 million
from the early retirement of debt.
(3) Includes net restructuring credits of $16.5 million, of which credits of $7.0 million
are included in cost of sales, a net charge for the impairment of long-lived assets of
$0.1 million, and net charges of $43.7 million, of which charges of $20.0 million are
included in cost of sales and net charges of $23.7 million are included in selling, gen-
eral and administrative expenses. In addition, includes a $151.8 million loss from the
retirement of debt and $18.7 million of interest income.
(4) Includes net restructuring and other charges of $7.9 million, of which charges of
$9.6 million are included in cost of sales, charges for the impairment of long-lived
assets of $737.6 million, charges for the impairment of goodwill of $278.4 million, and
other charges totaling $49.8 million, of which $14.0 million is included in cost of sales
related to the dismantlement of customers’ ADT security systems, and $35.8 million is
included in selling, general and administrative expenses primarily related to uncol-
lectible receivables and severance of corporate employees. Also includes charges of
$11.5 million for the write down of investments, an other charge of $0.1 million and a
charge of $2.4 million, which is included in interest expense. Net income also includes
an after-tax loss of $75.1 million for the cumulative effect of an accounting change.