ADT 2003 Annual Report Download - page 38
Download and view the complete annual report
Please find page 38 of the 2003 ADT annual report below. You can navigate through the pages in the report by either clicking on the pages listed below, or by using the keyword search tool below to find specific information within the annual report.-
 1
1 -
2
-
3
-
4
-
5
-
6
-
7
-
8
-
9
-
10
-
11
-
12
-
13
-
14
-
15
-
16
-
17
-
18
-
19
-
20
-
21
-
22
-
23
-
24
-
25
-
26
-
27
-
 28
28 -
 29
29 -
 30
30 -
 31
31 -
 32
32 -
 33
33 -
 34
34 -
 35
35 -
 36
36 -
 37
37 -
 38
38 -
 39
39 -
 40
40 -
 41
41 -
 42
42 -
 43
43 -
 44
44 -
 45
45 -
 46
46 -
 47
47 -
 48
48 -
49
-
50
-
51
-
52
-
53
-
54
-
55
-
56
-
57
-
58
-
59
-
60
-
61
-
62
-
63
-
64
-
65
-
66
-
67
-
68
-
69
-
70
-
71
-
72
-
73
-
74
-
75
-
76
-
77
-
78
-
79
-
80
-
81
-
82
-
83
-
84
-
85
-
86
-
87
-
88
-
89
-
90
-
91
-
92
-
93
-
94
-
95
-
96
-
97
-
98
-
99
-
100
-
101
-
102
-
103
-
104
-
105
-
106
-
107
-
108
-
109
-
110
-
111
-
112
-
113
-
114
-
115
-
116
-
117
-
118
-
119
-
120
-
121
-
122
-
123
-
124
-
125
-
126
-
127
-
128
-
129
-
130
-
131
-
132
 |
 |

36
Net revenues for the Healthcare segment increased 11.8% in
fiscal 2002 over fiscal 2001 including a 11.8% increase in prod-
uct revenue and a 10.1% increase in service revenue, primarily
as a result of increased sales volume resulting from acquisitions
in our U.S. healthcare businesses and, to a much lesser extent,
increased revenues from our domestic and international
healthcare businesses. Excluding the $11.2 million decrease
from foreign currency exchange fluctuations and the acquisi-
tions of Mallinckrodt Inc. (“Mallinckrodt”) in October 2000,
InnerDyne, Inc. in December 2000, Paragon, and all other
acquisitions with a purchase price of $10 million or more,
pro forma revenues (calculated in the manner described
above in “Overview”) for the Healthcare segment increased an
estimated 2.9%.
Operating income increased 22.4% in fiscal 2002 compared
to fiscal 2001 primarily due to a decrease in charges recorded in
fiscal 2002 as compared to fiscal 2001, as well as the impact of
acquisitions and operating efficiencies realized from cost
reductions at Mallinckrodt. This increase was partially offset by
lower margins of businesses acquired at Tyco Healthcare.
Operating income and margins for fiscal 2002 reflect net
restructuring and other charges of $44.8 million. The $44.8
million net charge includes charges of $48.7 million, of which
inventory write downs of $0.5 million are included in cost of
sales. These charges primarily relate to severance associated
with the consolidation of operations and facility-related costs
due to exiting certain business lines, and are partially offset by
a credit of $3.9 million relating to current and prior years’
restructuring charges. Operating income and margins for fiscal
2002 also include a charge for the write off of long-lived assets
of $2.5 million primarily related to the impairment of long-
lived assets.
Operating income and margins for fiscal 2001 include net
restructuring and other charges of $48.4 million primarily related
to the closure of several manufacturing plants. Included within
the $48.4 million are charges of $64.0 million, of which charges
of $35.0 million for the write-up of inventory under purchase
accounting and inventory write downs of $5.0 million are
included in cost of sales, partially offset by credits of $15.6 mil-
lion related to the merger with U.S. Surgical. Operating income
and margins also include a charge of $184.3 million for the
write off of purchased in-process research and development
associated with the acquisition of Mallinckrodt and charges of
$14.2 million for the impairment of property, plant and equip-
ment related to the closure of the manufacturing plants.
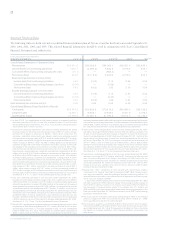
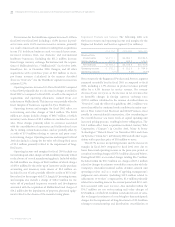
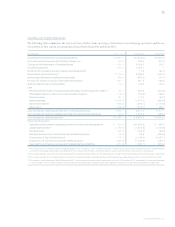
Engineered Products and Services The following table sets
forth net revenues and operating income and margins for the
Engineered Products and Services segment ($ in millions):
FISCAL 2003 FISCAL 2002 FISCAL 2001
Revenue from
product sales $4,010.1 $4,064.1 $3,594.5
Service revenue 674.3 645.2 576.3
Net revenues $4,684.4 $4,709.3 $4,170.8
Operating income $«««355.2 $«««252.5 $«««704.8
Operating margins 7.6% 5.4% 16.9%
Net revenues for the Engineered Products and Services segment
remained essentially level in fiscal 2003 as compared to fiscal
2002, including a 1.3% decrease in product revenue partially
offset by a 4.5% increase in service revenue. Net revenue
decreased year over year, as the increase in net revenues due
to favorable changes in foreign currency exchange rates
($233.1 million calculated in the manner described above in
“Overview”) and the effect of acquisitions ($41.2 million) was
more than offset by continued weak conditions in major mar-
kets at Flow Control and Electrical and Metal Products, most
notably in non-residential construction. Also contributing to
the overall decrease was lower levels of capital spending and
increased pricing pressure, resulting in lower selling prices. The
$41.2 million effect from acquisitions included Century Tube
Corporation (“Century”) in October 2001, Water & Power
Technologies (“Water & Power”) in November 2001, and Clean
Air Systems (“Clean Air”) in February 2002 and all other acqui-
sitions with a purchase price of $10 million or more.
The 40.7% increase in operating income and the increase in
margins in fiscal 2003 compared to fiscal 2002 were due to
lower than usual operating income in the prior year period, as
a result of recording charges of $379.5 million (discussed below).
During fiscal 2003, we recorded charges totaling $56.7 million.
Included within the $56.7 million are charges of $33.1 million
related to changes in estimates recorded in connection with the
Company’s intensified internal audits, detailed controls and
operating reviews and as a result of applying management’s
judgments and estimates (including $19.0 million related to
adjustments to workers’ compensation, $1.0 million primarily
related to reconciling items in the current period and $13.1 mil-
lion associated with asset reserves). Also included within the
$56.7 million are net restructuring and other charges of
$7.8 million, of which $6.1 million is included in cost of sales,
due to changes in estimates of costs being less than anticipated;
charges for the impairment of long-lived assets of $2.2 million
relating to manufacturing and distribution consolidation at
TYCO INTERNATIONAL LTD.
Management’s Discussion and Analysis of Financial Condition and Results of Operations