ADT 2003 Annual Report Download - page 90
Download and view the complete annual report
Please find page 90 of the 2003 ADT annual report below. You can navigate through the pages in the report by either clicking on the pages listed below, or by using the keyword search tool below to find specific information within the annual report.-
 1
1 -
2
-
3
-
4
-
5
-
6
-
7
-
8
-
9
-
10
-
11
-
12
-
13
-
14
-
15
-
16
-
17
-
18
-
19
-
20
-
21
-
22
-
23
-
24
-
25
-
26
-
27
-
28
-
29
-
30
-
31
-
32
-
33
-
34
-
35
-
36
-
37
-
38
-
39
-
40
-
41
-
42
-
43
-
44
-
45
-
46
-
47
-
48
-
49
-
50
-
51
-
52
-
53
-
54
-
55
-
56
-
57
-
58
-
59
-
60
-
61
-
62
-
63
-
64
-
65
-
66
-
67
-
68
-
69
-
70
-
71
-
72
-
73
-
74
-
75
-
76
-
77
-
78
-
79
-
 80
80 -
 81
81 -
 82
82 -
 83
83 -
 84
84 -
 85
85 -
 86
86 -
 87
87 -
 88
88 -
 89
89 -
 90
90 -
 91
91 -
 92
92 -
 93
93 -
 94
94 -
 95
95 -
 96
96 -
 97
97 -
 98
98 -
 99
99 -
 100
100 -
101
-
102
-
103
-
104
-
105
-
106
-
107
-
108
-
109
-
110
-
111
-
112
-
113
-
114
-
115
-
116
-
117
-
118
-
119
-
120
-
121
-
122
-
123
-
124
-
125
-
126
-
127
-
128
-
129
-
130
-
131
-
132
 |
 |

88
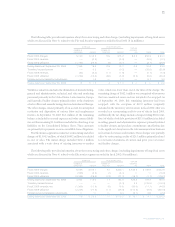
The following table provides information about the restructuring and other charges (excluding impairments of long-lived
assets, which are discussed in Note 6) related to the Fire and Security segment recorded in fiscal 2001 ($ in millions):
SEVERANCE FACILITIES-RELATED SUPPLIER
NUMBER OF NUMBER OF CONTRACT
EMPLOYEES AMOUNT FACILITIES AMOUNT FEE OTHER TOTAL
Fiscal 2001 charges 972 $13.0 176 $«47.6 $««— $19.7 $«80.3
Fiscal 2001 utilization (411) (4.8) (53) (1.2) — (3.3) (9.3)
Ending balance at September 30, 2001 561 8.2 123 46.4 — 16.4 71.0
Fiscal 2002 reversals (118) (0.3) — (13.9) — — (14.2)
Fiscal 2002 utilization (232) (5.6) (100) (8.1) — (8.0) (21.7)
Transfers/reclassifications — — — (0.2) 0.2 — —
Ending balance at September 30, 2002 211 2.3 23 24.2 0.2 8.4 35.1
Transfers/reclassifications —————(7.2)(7.2)
Fiscal 2003 reversals — (2.0) — (7.4) (0.2) (0.5) (10.1)
Fiscal 2003 utilization (211) (0.5) (23) (5.8) — (0.8) (7.1)
Foreign currency translation adjustments —0.2 —0.1 —0.10.4
Ending balance at September 30, 2003 — $«««— — $«11.1 $««— $«««— $«11.1
Workforce reductions primarily relate to the elimination of man-
ufacturing, general and administrative, and sales and marketing
personnel in the United States and Europe. Facility closures pri-
marily relate to the shutdown of sales offices and manufacturing
plants in the United States, Europe and Canada. The other
charges of $19.7 million consist primarily of contract cancellation
costs and charges relating to an environmental remediation
project. At September 30, 2003, $5.6 million of the remaining bal-
ance is included in accrued expenses and other current liabilities
and the remaining $5.5 million is included in other long-term
liabilities on the Consolidated Balance Sheet. These amounts
are primarily for payments on non-cancellable lease obligations.
In fiscal 2001, the Electronics segment recorded restructur-
ing and other charges of $383.8 million, of which $125.8 million
is included in cost of sales. The $383.8 million charge includes
charges of $258.0 million related primarily to facility closures
and related employee terminations within the computer and
consumer electronics and communication industries.
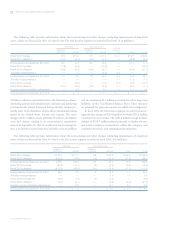
TYCO INTERNATIONAL LTD.
Notes to Consolidated Financial Statements
The following table provides information about the restructuring and other charges (excluding impairments of long-lived
assets, which are discussed in Note 6) related to the Electronics segment recorded in fiscal 2001 ($ in millions):
SEVERANCE FACILITIES-RELATED
NUMBER OF NUMBER OF
EMPLOYEES AMOUNT FACILITIES AMOUNT OTHER TOTAL
Fiscal 2001 charges 10,375 $177.1 38 $«44.4 $«36.5 $«258.0
Fiscal 2001 utilization (6,020) (70.5) (12) (10.2) (17.5) (98.2)
Ending balance at September 30, 2001 4,355 106.6 26 34.2 19.0 159.8
Fiscal 2002 reversals (573) (14.1) (2) (0.5) (0.8) (15.4)
Fiscal 2002 utilization (3,524) (82.9) (22) (18.2) (11.1) (112.2)
Ending balance at September 30, 2002 258 9.6 2 15.5 7.1 32.2
Transfers/reclassifications — — — 0.6 — 0.6
Fiscal 2003 reversals, net (166) (1.9) (2) (1.4) — (3.3)
Fiscal 2003 utilization (91) (6.7) — (9.8) (4.8) (21.3)
Foreign currency translation adjustments — 0.3 — 0.1 0.1 0.5
Ending balance at September 30, 2003 1 $««««1.3 — $«««5.0 $«««2.4 $«««««8.7