ADT 2003 Annual Report Download - page 28
Download and view the complete annual report
Please find page 28 of the 2003 ADT annual report below. You can navigate through the pages in the report by either clicking on the pages listed below, or by using the keyword search tool below to find specific information within the annual report.-
 1
1 -
2
-
3
-
4
-
5
-
6
-
7
-
8
-
9
-
10
-
11
-
12
-
13
-
14
-
15
-
16
-
17
-
 18
18 -
 19
19 -
 20
20 -
 21
21 -
 22
22 -
 23
23 -
 24
24 -
 25
25 -
 26
26 -
 27
27 -
 28
28 -
 29
29 -
 30
30 -
 31
31 -
 32
32 -
 33
33 -
 34
34 -
 35
35 -
 36
36 -
 37
37 -
 38
38 -
39
-
40
-
41
-
42
-
43
-
44
-
45
-
46
-
47
-
48
-
49
-
50
-
51
-
52
-
53
-
54
-
55
-
56
-
57
-
58
-
59
-
60
-
61
-
62
-
63
-
64
-
65
-
66
-
67
-
68
-
69
-
70
-
71
-
72
-
73
-
74
-
75
-
76
-
77
-
78
-
79
-
80
-
81
-
82
-
83
-
84
-
85
-
86
-
87
-
88
-
89
-
90
-
91
-
92
-
93
-
94
-
95
-
96
-
97
-
98
-
99
-
100
-
101
-
102
-
103
-
104
-
105
-
106
-
107
-
108
-
109
-
110
-
111
-
112
-
113
-
114
-
115
-
116
-
117
-
118
-
119
-
120
-
121
-
122
-
123
-
124
-
125
-
126
-
127
-
128
-
129
-
130
-
131
-
132
 |
 |

26
TYCO INTERNATIONAL LTD.
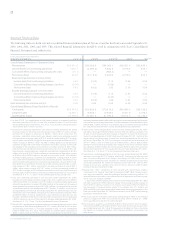
Selected Financial Data
The following table sets forth selected consolidated financial information of Tyco as at and for the fiscal years ended September 30,
2003, 2002, 2001, 2000, and 1999. This selected financial information should be read in conjunction with Tyco’s Consolidated
Financial Statements and related notes.
(IN MILLIONS, EXCEPT PER SHARE DATA)
YEAR ENDED SEPTEMBER 30, 2003(1) (2) 2002(3) 2001(4) (5) 2000(6) 1999(7) (8)
Consolidated Statements of Operations Data:
Net revenues $36,801.3 $35,589.8 $34,002.1 $28,927.5 $22,494.1
Income (loss) from continuing operations 1,034.7 (2,838.2) 3,894.9 4,318.5 873.7
Cumulative effect of accounting changes, net of tax (75.1) — (683.4) — —
Net income (loss) 979.6 (9,179.5) 3,464.0 4,318.5 873.7
Basic earnings (loss) per common share:
Income (loss) from continuing operations 0.52 (1.43) 2.16 2.56 0.53
Cumulative effect of accounting changes, net of tax (0.04) — (0.38) — —
Net income (loss) 0.49 (4.62) 1.92 2.56 0.53
Diluted earnings (loss) per common share:
Income (loss) from continuing operations 0.52 (1.43) 2.13 2.52 0.52
Cumulative effect of accounting changes, net of tax (0.04) — (0.37) — —
Net income (loss) 0.49 (4.62) 1.89 2.52 0.52
Cash dividends per common share (9) 0.05 0.05 0.05 0.05 0.05
Consolidated Balance Sheet Data (End of Period):
Total assets $63,545.0 $65,499.8 $70,413.2 $39,995.6 $32,106.2
Long-term debt 18,250.7 16,529.1 19,596.0 9,461.8 9,109.4
Shareholders’ equity 26,369.0 24,081.3 31,080.3 16,612.7 12,136.7
(1) In fiscal 2003, Tyco consolidated variable interest entities in accordance with the
transition provisions of FIN 46, as more fully described in Notes 12 and 30 to the
Consolidated Financial Statements. As a result, Tyco recorded a cumulative effect
adjustment of $75.1 million, net of tax.
(2) Income from continuing operations in the fiscal year ended September 30, 2003
includes charges for the impairment of long-lived assets of $814.7 million, charges
recorded for changes in estimates of $388.7 million which arose from the
Company’s intensified internal audits and detailed controls and operating reviews
(includes net restructuring credits of $72.5, of which credits totaling $12.9 million
are included in cost of sales, charges for the impairment of long-lived assets of $10.2
million, charges of $243.1 million included in selling, general and administrative
expenses, charges of $123.4 million included in cost of sales, a charge of $75.6 mil-
lion relating to the write-down of investments and other expense of $8.5 million,
both of which are included in other (expense) income, net and a charge of $0.4 mil-
lion included in interest expense), charges for the impairment of goodwill of $278.4
million, other loss of $151.8 million related to the retirement of debt, other charges
of $148.6 million ($34.0 million is included in cost of sales and $114.6 million is
included in selling, general and administrative expenses), a charge of $91.5 million
for a retroactive incremental premium on prior period directors and officers insur-
ance included in selling, general and administrative expenses, a charge of $11.5 mil-
lion relating to the write-down of investments, other interest expense of $2.4 million,
other expense of $0.1 million, income from the early retirement of debt of $24.1
million, other interest income of $18.7 million, and net restructuring credits of
$12.3 million (charges of $2.4 million are included in cost of sales). Net income also
includes $20.0 million of income from the discontinued operations of Tyco Capital.
See Notes 5, 6, 8, 11, 17 and 31 to the Consolidated Financial Statements.
(3) Loss from continuing operations in the fiscal year ended September 30, 2002
includes net restructuring and other charges of $1,874.7 million (of which $635.4
million is included in cost of sales and $115.0 million is included in selling, general and
administrative expenses), charges of $3,309.5 million for the impairment of long-lived
assets, goodwill impairment charges of $1,343.7 million, and a charge for the write off
of purchased research and development of $17.8 million. In addition, loss from con-
tinuing operations for the fiscal year ended September 30, 2002 includes a loss on
investments of $270.8 million, a net gain on the sale of businesses of $23.6 million
and $30.6 million of income relating to the early retirement of debt. Net loss also
includes a $6,282.5 million loss from the discontinued operations of Tyco Capital and
a $58.8 million loss on sale of Tyco Capital for the year ended September 30, 2002.
See Notes 5, 6, 7, 8, 11 and 17 to the Consolidated Financial Statements.
(4) In fiscal 2001, we changed our revenue recognition accounting policy to conform to the
requirements of Staff Accounting Bulletin No. 101 issued by the Staff of the Securities
and Exchange Commission, as more fully described in Note 12 to the Consolidated
Financial Statements. As a result, Tyco recorded a cumulative effect adjustment of
$653.7 million, net of tax. Pro forma amounts for the periods prior to fiscal 2001 have
not been presented since the effect of the change in accounting principles for these peri-
ods could not be reasonably determined. Tyco also recorded a cumulative effect adjust-
ment of $29.7 million, net of tax, in accordance with the transition provisions of SFAS
No. 133, also discussed in Note 12 to the Consolidated Financial Statements.
(5) Income from continuing operations in the fiscal year ended September 30, 2001
includes a net charge of $585.3 million, of which $184.9 million is included in cost
of sales, for restructuring and other charges, a charge for the write off of in-process
research and development of $184.3 million and charges of $120.1 million for the
impairment of long-lived assets. Income from continuing operations for the fiscal
year ended September 30, 2001 also includes a net gain on sale of businesses of
$410.4 million, a loss on investments of $133.8 million, a loss of $26.3 million
relating to the early retirement of debt and a net gain on the sale of common shares
of a subsidiary of $24.5 million. Net income includes $252.5 million of income from
discontinued operations of Tyco Capital for the year ended September 30, 2001.
See Notes 5, 6, 7, 8, 9 and 11 to the Consolidated Financial Statements.
(6) Income from continuing operations in the fiscal year ended September 30, 2000
includes a net charge of $176.3 million, of which $1.0 million is included in cost of
sales, for restructuring and other charges, and charges of $99.0 million for the
impairment of long-lived assets. Income from continuing operations for the fiscal
year ended September 30, 2000 also includes a pre-tax gain of $1,760.0 million
related to the sale by a subsidiary of its common shares, and a loss of $0.3 million
relating to the early retirement of debt.
(7) During fiscal 1999, subsidiaries of Tyco merged with United States Surgical
Corporation (“U.S. Surgical”) and AMP Incorporated (“AMP”). Both merger transac-
tions were accounted for under the pooling of interests accounting method. The
selected financial data reflect the combined results of operations and financial posi-
tion of Tyco, U.S. Surgical and AMP.
Income from continuing operations in the fiscal year ended September 30, 1999
includes charges of $1,035.2 million for merger, restructuring and other charges, of
which $106.4 million is included in cost of sales, and charges of $507.5 million for
the impairment of long-lived assets related to the mergers with U.S. Surgical and
AMP and AMP’s profit improvement plan. Income from continuing operations in the
fiscal year ended September 30, 1999 also includes a loss of $63.7 million relating
to the early retirement of debt.
(8) Per share amounts have been retroactively restated to give effect to the mergers
with U.S. Surgical and AMP; and a two-for-one stock split on October 21, 1999,
which was effected in the form of a stock dividend.
(9) Tyco has paid a quarterly cash dividend of $0.0125 per common share for all peri-
ods presented. AMP paid dividends of $0.27 per share in the first two quarters of the
year ended September 30, 1999. The payment of dividends by Tyco in the future
will depend on business conditions, Tyco’s financial condition and earnings and
other factors.