ADT 2003 Annual Report Download - page 70
Download and view the complete annual report
Please find page 70 of the 2003 ADT annual report below. You can navigate through the pages in the report by either clicking on the pages listed below, or by using the keyword search tool below to find specific information within the annual report.-
 1
1 -
2
-
3
-
4
-
5
-
6
-
7
-
8
-
9
-
10
-
11
-
12
-
13
-
14
-
15
-
16
-
17
-
18
-
19
-
20
-
21
-
22
-
23
-
24
-
25
-
26
-
27
-
28
-
29
-
30
-
31
-
32
-
33
-
34
-
35
-
36
-
37
-
38
-
39
-
40
-
41
-
42
-
43
-
44
-
45
-
46
-
47
-
48
-
49
-
50
-
51
-
52
-
53
-
54
-
55
-
56
-
57
-
58
-
59
-
 60
60 -
 61
61 -
 62
62 -
 63
63 -
 64
64 -
 65
65 -
 66
66 -
 67
67 -
 68
68 -
 69
69 -
 70
70 -
 71
71 -
 72
72 -
 73
73 -
 74
74 -
 75
75 -
 76
76 -
 77
77 -
 78
78 -
 79
79 -
 80
80 -
81
-
82
-
83
-
84
-
85
-
86
-
87
-
88
-
89
-
90
-
91
-
92
-
93
-
94
-
95
-
96
-
97
-
98
-
99
-
100
-
101
-
102
-
103
-
104
-
105
-
106
-
107
-
108
-
109
-
110
-
111
-
112
-
113
-
114
-
115
-
116
-
117
-
118
-
119
-
120
-
121
-
122
-
123
-
124
-
125
-
126
-
127
-
128
-
129
-
130
-
131
-
132
 |
 |

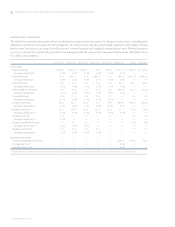
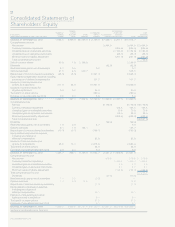
68
TYCO INTERNATIONAL LTD.
COMMON ACCUMULATED
NUMBER OF SHARES CONTRIBUTED OTHER COMP- COMP-
(IN MILLIONS) COMMON $0.20 PAR SHARE SURPLUS ACCUMULATED REHENSIVE REHENSIVE
YEARS ENDED SEPTEMBER 30, 2001, 2002 AND 2003 SHARES VALUE PREMIUM COMMON EARNINGS INCOME (LOSS) TOTAL INCOME (LOSS)
BALANCE AT SEPTEMBER 30, 2000 1,684.5 $336.9 $5,233.3 $««2,786.3 $7,989.1 $«267.1 $16,612.7
Comprehensive income:
Net income 3,464.0 3,464.0 $«3,464.0
Currency translation adjustment (204.9) (204.9) (204.9)
Unrealized loss on marketable securities (1,162.6) (1,162.6) (1,162.6)
Unrealized loss on derivative instruments (65.7) (65.7) (65.7)
Minimum pension liability adjustment (261.0) (261.0) (261.0)
Total comprehensive income $«1,769.8
Sale of common shares 39.0 7.8 2,188.8 2,196.6
Dividends (92.5) (92.5)
Restricted stock grants, net of surrenders 2.7 0.5 0.2 0.7
Options exercised 21.5 4.3 540.7 545.0
Repurchase of common shares by subsidiary (25.0) (5.0) (1,321.1) (1,326.1)
Equity-related compensation expense, including
amortization of deferred compensation 107.7 107.7
Issuance of common shares and
options for acquisitions 211.3 42.3 10,947.3 10,989.6
Issuance of common shares for
litigation settlement 0.9 0.2 39.8 40.0
Tax benefit on share options 230.9 230.9
Exchange of convertible debt due 2010 0.6 0.1 5.8 5.9
BALANCE AT SEPTEMBER 30, 2001 1,935.5 387.1 7,962.8 12,796.9 11,360.6 (1,427.1) 31,080.3
Comprehensive loss:
Net loss (9,179.5) (9,179.5) $(9,179.5)
Currency translation adjustment 105.5 105.5 105.5
Unrealized gain on marketable securities 73.8 73.8 73.8
Unrealized gain on derivative instruments 65.0 65.0 65.0
Minimum pension liability adjustment (405.8) (405.8) (405.8)
Total comprehensive loss $(9,341.0)
Dividends (99.9) (99.9)
Restricted stock grants, net of surrenders 1.6 0.3 2.7 3.0
Options exercised 8.1 1.6 184.1 185.7
Repurchase of common shares by subsidiary (15.7) (3.1) (786.1) (789.2)
Equity-related compensation expense,
including amortization of
deferred compensation 92.9 92.9
Issuance of common shares and
options for acquisitions 65.6 13.1 2,875.8 2,888.9
Tax benefit on share options 54.3 54.3
Exchange of convertible debt due 2010 0.6 0.1 6.2 6.3
BALANCE AT SEPTEMBER 30, 2002 1,995.7 399.1 8,146.9 15,042.7 2,081.2 (1,588.6) 24,081.3
Comprehensive income:
Net income 979.6 979.6 $÷÷979.6
Currency translation adjustment 1,445.4 1,445.4 1,445.4
Unrealized gain on marketable securities 2.0 2.0 2.0
Unrealized gain on derivative instruments 2.7 2.7 2.7
Minimum pension liability adjustment (134.8) (134.8) (134.8)
Total comprehensive income $«2,294.9
Dividends (99.6) (99.6)
Restricted stock grants, net of surrenders 1.1 0.2 (0.2) —
Options exercised 1.4 0.3 14.5 14.8
Repurchase of common shares by subsidiary (1.2) (1.2)
Equity-related compensation expense,
including amortization of
deferred compensation 38.1 38.1
Expiration of pre-existing put option
rights assumed in acquisition 3.1 3.1
Tax benefit on share options 37.5 37.5
Exchange of convertible debt due 2010 0.1 0.1
BALANCE AT SEPTEMBER 30, 2003 1,998.2 $399.6 $8,161.4 $15,120.1 $2,961.2 $(273.3) $26,369.0
See Notes to Consolidated Financial Statements.
Consolidated Statements of
Shareholders’ Equity