ADT 2003 Annual Report Download - page 111
Download and view the complete annual report
Please find page 111 of the 2003 ADT annual report below. You can navigate through the pages in the report by either clicking on the pages listed below, or by using the keyword search tool below to find specific information within the annual report.-
 1
1 -
2
-
3
-
4
-
5
-
6
-
7
-
8
-
9
-
10
-
11
-
12
-
13
-
14
-
15
-
16
-
17
-
18
-
19
-
20
-
21
-
22
-
23
-
24
-
25
-
26
-
27
-
28
-
29
-
30
-
31
-
32
-
33
-
34
-
35
-
36
-
37
-
38
-
39
-
40
-
41
-
42
-
43
-
44
-
45
-
46
-
47
-
48
-
49
-
50
-
51
-
52
-
53
-
54
-
55
-
56
-
57
-
58
-
59
-
60
-
61
-
62
-
63
-
64
-
65
-
66
-
67
-
68
-
69
-
70
-
71
-
72
-
73
-
74
-
75
-
76
-
77
-
78
-
79
-
80
-
81
-
82
-
83
-
84
-
85
-
86
-
87
-
88
-
89
-
90
-
91
-
92
-
93
-
94
-
95
-
96
-
97
-
98
-
99
-
100
-
 101
101 -
 102
102 -
 103
103 -
 104
104 -
 105
105 -
 106
106 -
 107
107 -
 108
108 -
 109
109 -
 110
110 -
 111
111 -
 112
112 -
 113
113 -
 114
114 -
 115
115 -
 116
116 -
 117
117 -
 118
118 -
 119
119 -
 120
120 -
 121
121 -
122
-
123
-
124
-
125
-
126
-
127
-
128
-
129
-
130
-
131
-
132
 |
 |

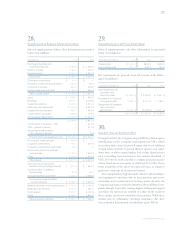
109
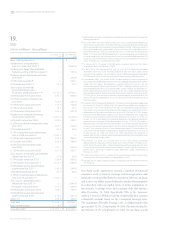
are based on various factors, such as years of service and com-
pensation. The following tables exclude amounts related to the
discontinued operations of CIT for all periods presented.
The net periodic benefit cost (income) for all U.S. and
non-U.S. defined benefit pension plans includes the following
components ($ in millions):
U.S. PLANS 2003 2002 2001
Service cost $««25.5 $«««19.2 $«««28.2
Interest cost 131.0 134.2 127.7
Expected return on
plan assets (99.2) (123.4) (170.6)
Recognition of initial net asset (1.0) (1.0) (1.0)
Recognition of prior service cost 2.8 0.8 0.6
Recognition of net actuarial
loss (gain) 39.0 8.8 (11.3)
Curtailment/settlement
loss (gain) 9.7 1.4 (56.8)
Cost of special termination
benefits 0.2 1.6 0.6
Net periodic benefit
cost (income) $108.0 $«««41.6 $««(82.6)
NON-U.S. PLANS 2003 2002 2001
Service cost $««85.0 $«69.0 $«65.4
Interest cost 101.3 88.1 79.2
Expected return on plan assets (74.7) (81.8) (96.8)
Recognition of initial
net obligation 0.5 0.1 0.2
Recognition of prior
service cost 1.0 0.9 1.7
Recognition of net
actuarial loss 43.1 15.1 0.5
Curtailment/settlement
loss (gain) 8.7 (2.3) 3.0
Cost of special termination
benefits 1.2 2.4 16.2
Net periodic benefit cost $166.1 $«91.5 $«69.4
The curtailment/settlement gains in fiscal 2001 in the U.S.
relate primarily to the freezing of certain pension plans. These
curtailment/settlement gains have been recorded in selling,
general and administrative expenses in the Consolidated State-
ments of Operations.
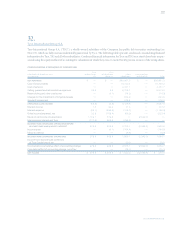
TYCO INTERNATIONAL LTD.
The net pension amount recognized on the Consolidated Balance Sheet at September 30, 2003 and 2002 for all U.S. and non-
U.S. defined benefit plans is as follows ($ in millions):
U.S. PLANS NON-U.S. PLANS
2003 2002 2003 2002
CHANGE IN BENEFIT OBLIGATION
Benefit obligation at beginning of year $2,048.1 $1,832.5 $1,938.3 $1,571.9
Service cost 25.5 19.2 85.0 69.0
Interest cost 131.0 134.2 101.3 88.1
Employee contributions ——10.7 9.9
Plan amendments 1.2 24.6 1.3 1.1
Actuarial loss 221.3 203.2 159.6 210.9
Benefits and administrative expenses paid (153.2) (155.9) (70.7) (74.8)
Acquisitions —15.6 17.9 12.9
Plan curtailments (1.6) (20.7) 2.0 (4.9)
Plan settlements (28.7) (6.2) (32.0) (20.0)
Special termination benefits 0.2 1.6 1.2 2.4
Currency translation adjustment ——199.3 71.8
Benefit obligation at end of year $2,243.8 $2,048.1 $2,413.9 $1,938.3