ADT 2003 Annual Report Download - page 48
Download and view the complete annual report
Please find page 48 of the 2003 ADT annual report below. You can navigate through the pages in the report by either clicking on the pages listed below, or by using the keyword search tool below to find specific information within the annual report.-
 1
1 -
2
-
3
-
4
-
5
-
6
-
7
-
8
-
9
-
10
-
11
-
12
-
13
-
14
-
15
-
16
-
17
-
18
-
19
-
20
-
21
-
22
-
23
-
24
-
25
-
26
-
27
-
28
-
29
-
30
-
31
-
32
-
33
-
34
-
35
-
36
-
37
-
 38
38 -
 39
39 -
 40
40 -
 41
41 -
 42
42 -
 43
43 -
 44
44 -
 45
45 -
 46
46 -
 47
47 -
 48
48 -
 49
49 -
 50
50 -
 51
51 -
 52
52 -
 53
53 -
 54
54 -
 55
55 -
 56
56 -
 57
57 -
 58
58 -
59
-
60
-
61
-
62
-
63
-
64
-
65
-
66
-
67
-
68
-
69
-
70
-
71
-
72
-
73
-
74
-
75
-
76
-
77
-
78
-
79
-
80
-
81
-
82
-
83
-
84
-
85
-
86
-
87
-
88
-
89
-
90
-
91
-
92
-
93
-
94
-
95
-
96
-
97
-
98
-
99
-
100
-
101
-
102
-
103
-
104
-
105
-
106
-
107
-
108
-
109
-
110
-
111
-
112
-
113
-
114
-
115
-
116
-
117
-
118
-
119
-
120
-
121
-
122
-
123
-
124
-
125
-
126
-
127
-
128
-
129
-
130
-
131
-
132
 |
 |

46
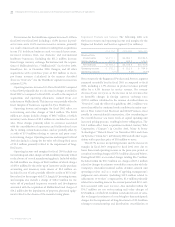
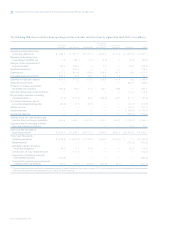
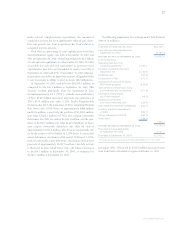
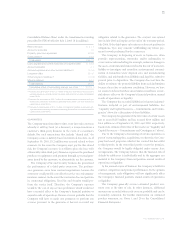
The following table shows cash flow from operating activities and other cash flow items by segment for fiscal 2003 ($ in millions).
ENGINEERED
FIRE AND PRODUCTS PLASTICS AND
SECURITY ELECTRONICS HEALTHCARE AND SERVICES ADHESIVES CORPORATE TOTAL
Operating income (loss) from
continuing operations $«««360.2 $«««457.7 $2,127.1 $355.2 $167.4 $÷«(400.6) $«3,067.0
Non-cash restructuring and
other charges (credits), net 6.3 (43.1) (1.2) (2.0) — (5.9) (45.9)
Charges for the impairment of
long-lived assets 143.0 658.9 — 2.2 — 20.8 824.9
Goodwill impairment — 278.4 ————278.4
Depreciation 611.3 451.8 250.0 104.4 45.5 8.9 1,471.9
Intangible assets amortization 590.3 66.0 63.0 3.8 1.9 — 725.0
Depreciation and amortization 1,201.6 517.8 313.0 108.2 47.4 8.9 2,196.9
Deferred income taxes —————348.9 348.9
Provision for losses on accounts
receivable and inventory 354.9 54.3 77.4 64.7 29.8 — 581.1
Debt and refinancing cost amortization —————116.4 116.4
Net (increase) decrease in working
capital and other (1) (71.2) (247.6) 59.0 (184.9) 35.7 311.7 (97.3)
(Decrease) increase in sale of
accounts receivable programs (34.3) (6.7) (57.8) — — (20.2) (119.0)
Interest income —————107.2 107.2
Interest expense —————(1,148.0) (1,148.0)
Income tax expense —————(764.5) (764.5)
Cash provided by (used in) operating
activities from continuing operations 1,960.5 1,669.7 2,517.5 343.4 280.3 (1,425.3) 5,346.1
Cash provided by operating activities
from discontinued operations —————20.020.0
Cash provided by (used in)
operating activities $1,960.5 $1,669.7 $2,517.5 $343.4 $280.3 $(1,405.3) $«5,366.1
Other Cash Flow Items:
Capital expenditures $««(509.8) $÷(403.0) $÷(192.4) $«(50.1) $«(22.0) $÷÷÷÷7.7 $(1,169.6)
Dividends paid —————(100.9) (100.9)
Decrease in sale of accounts
receivable programs 34.3 6.7 57.8 — — 20.2 119.0
Construction of Tyco Global Network — (112.7) ————(112.7)
Acquisition of customer accounts
(ADT dealer program) (596.8) —————(596.8)
Cash paid for purchase accounting and
holdback/earn-out liabilities (81.0) (67.2) (52.8) (66.3) (4.5) — (271.8)
(1) These amounts include cash paid out for restructuring and other charges. Additionally, this amount includes $151.8 million related to a loss on the retirement of debt associated
with the 6.25% Dealer Remarketable Securities (“Drs.”) due 2013 for fiscal 2003.
TYCO INTERNATIONAL LTD.
Management’s Discussion and Analysis of Financial Condition and Results of Operations