ADT 2003 Annual Report Download - page 31
Download and view the complete annual report
Please find page 31 of the 2003 ADT annual report below. You can navigate through the pages in the report by either clicking on the pages listed below, or by using the keyword search tool below to find specific information within the annual report.-
 1
1 -
2
-
3
-
4
-
5
-
6
-
7
-
8
-
9
-
10
-
11
-
12
-
13
-
14
-
15
-
16
-
17
-
18
-
19
-
20
-
 21
21 -
 22
22 -
 23
23 -
 24
24 -
 25
25 -
 26
26 -
 27
27 -
 28
28 -
 29
29 -
 30
30 -
 31
31 -
 32
32 -
 33
33 -
 34
34 -
 35
35 -
 36
36 -
 37
37 -
 38
38 -
 39
39 -
 40
40 -
 41
41 -
42
-
43
-
44
-
45
-
46
-
47
-
48
-
49
-
50
-
51
-
52
-
53
-
54
-
55
-
56
-
57
-
58
-
59
-
60
-
61
-
62
-
63
-
64
-
65
-
66
-
67
-
68
-
69
-
70
-
71
-
72
-
73
-
74
-
75
-
76
-
77
-
78
-
79
-
80
-
81
-
82
-
83
-
84
-
85
-
86
-
87
-
88
-
89
-
90
-
91
-
92
-
93
-
94
-
95
-
96
-
97
-
98
-
99
-
100
-
101
-
102
-
103
-
104
-
105
-
106
-
107
-
108
-
109
-
110
-
111
-
112
-
113
-
114
-
115
-
116
-
117
-
118
-
119
-
120
-
121
-
122
-
123
-
124
-
125
-
126
-
127
-
128
-
129
-
130
-
131
-
132
 |
 |

29
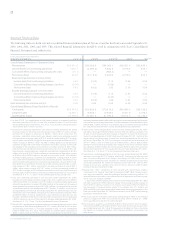
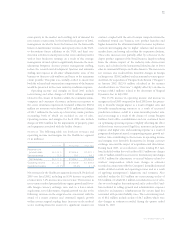
The following table details net revenues and earnings in fiscal 2003, fiscal 2002 and fiscal 2001 ($ in millions):
FISCAL 2003 FISCAL 2002 FISCAL 2001
Revenue from product sales $29,427.7 $28,741.8 $28,953.1
Service revenue 7,373.6 6,848.0 5,049.0
NET REVENUES $36,801.3 $35,589.8 $34,002.1
OPERATING INCOME (LOSS) $÷3,067.0 $«(1,452.4) $÷5,616.4
Interest income 107.2 117.3 128.3
Interest expense (1,148.0) (1,077.0) (904.8)
Other (expense) income, net (223.4) (216.6) 250.3
Net gain on sale of common shares of a subsidiary —— 24.5
INCOME (LOSS) FROM CONTINUING OPERATIONS BEFORE INCOME TAXES
AND MINORITY INTEREST 1,802.8 (2,628.7) 5,114.7
Income taxes (764.5) (208.1) (1,172.3)
Minority interest (3.6) (1.4) (47.5)
INCOME (LOSS) FROM CONTINUING OPERATIONS 1,034.7 (2,838.2) 3,894.9
Income (loss) from discontinued operations of Tyco Capital, net of tax 20.0 (6,282.5) 252.5
Loss on sale of Tyco Capital, net of tax —(58.8) —
Income (loss) before cumulative effect of accounting changes 1,054.7 (9,179.5) 4,147.4
Cumulative effect of accounting changes, net of tax (75.1) — (683.4)
NET INCOME (LOSS) $÷÷«979.6 $«(9,179.5) $««3,464.0
During the fourth quarter of fiscal 2003, we completed a com-
prehensive review of Tyco’s core businesses, and as a result, have
initiated a divestiture and restructuring program. As part of
this program, we plan to sell the TGN, our undersea fiber optic
telecommunications system. The market for the TGN is chal-
lenged by significant overcapacity and severe pricing pressure
and the industry is in need of consolidation. However, we plan
to retain ownership of the construction and maintenance por-
tion of Tyco Submarine Telecommunications. In addition to
selling the TGN, we are also starting a broader divestiture pro-
gram designed to increase the focus on our core operations by
exiting certain operations that do not meet our criteria for
strategic fit or financial returns. Combined fiscal 2003 revenues
for businesses under consideration for potential divestiture
within the Electronics, Fire and Security, Engineered Products
and Services, and Healthcare segments totaled approximately
$2 billion and operating income totaled approximately $55 mil-
lion (excluding operating loss from the TGN of $115 million).
Overall, this entire potential divestiture program represents just
below 6% of Tyco’s fiscal 2003 revenue. We are estimating that
the potential proceeds (excluding the proceeds from the sale of
the TGN) could be at least $400 million once the program is
completed. If we dispose of these businesses, we may not fully
recover their recorded book values. At September 30, 2003,
however, under the held and used model, the assets of these
businesses were fully recoverable. The restructuring program
TYCO INTERNATIONAL LTD.
announced in November 2003 is designed to improve our cost
structure primarily in Fire and Security, but also in Plastics
and Adhesives and in the Engineered Products and Services
segment and is an important element of building a stronger
operating foundation.
During fiscal 2002, we recorded restructuring and other
charges and charges for the impairment of long-lived assets
related primarily to the significant decrease in demand in certain
end markets within our Electronics segment. Under our restruc-
turing and integration programs, we terminate employees and
close facilities made redundant. The reduction in manpower
and facilities comes from the manufacturing, sales and admin-
istrative functions. In addition, we discontinue or dispose of
product lines, which do not fit the long-term strategy of the
respective businesses. We have not historically tracked the
impact on financial results of the restructuring and integration
programs. However, we estimate that our overall cost structure
has been reduced by approximately $910 million on an annual-
ized basis, of which approximately $315 million relates to selling,
general and administrative expenses, and approximately $595
million to cost of sales. The $910 million estimated overall
annualized cost savings as a result of restructuring activities in
fiscal 2002 was based on a summary of estimated cost savings.
In determining the amount of cost savings, management looked
at the salaries and benefits of the people that were terminated
to derive the annual savings. As it relates to facility closures, the