ADT 2003 Annual Report Download - page 125
Download and view the complete annual report
Please find page 125 of the 2003 ADT annual report below. You can navigate through the pages in the report by either clicking on the pages listed below, or by using the keyword search tool below to find specific information within the annual report.-
 1
1 -
2
-
3
-
4
-
5
-
6
-
7
-
8
-
9
-
10
-
11
-
12
-
13
-
14
-
15
-
16
-
17
-
18
-
19
-
20
-
21
-
22
-
23
-
24
-
25
-
26
-
27
-
28
-
29
-
30
-
31
-
32
-
33
-
34
-
35
-
36
-
37
-
38
-
39
-
40
-
41
-
42
-
43
-
44
-
45
-
46
-
47
-
48
-
49
-
50
-
51
-
52
-
53
-
54
-
55
-
56
-
57
-
58
-
59
-
60
-
61
-
62
-
63
-
64
-
65
-
66
-
67
-
68
-
69
-
70
-
71
-
72
-
73
-
74
-
75
-
76
-
77
-
78
-
79
-
80
-
81
-
82
-
83
-
84
-
85
-
86
-
87
-
88
-
89
-
90
-
91
-
92
-
93
-
94
-
95
-
96
-
97
-
98
-
99
-
100
-
101
-
102
-
103
-
104
-
105
-
106
-
107
-
108
-
109
-
110
-
111
-
112
-
113
-
114
-
 115
115 -
 116
116 -
 117
117 -
 118
118 -
 119
119 -
 120
120 -
 121
121 -
 122
122 -
 123
123 -
 124
124 -
 125
125 -
 126
126 -
 127
127 -
 128
128 -
 129
129 -
 130
130 -
 131
131 -
 132
132
 |
 |

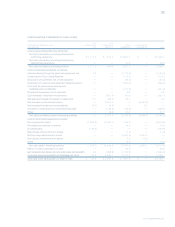
123
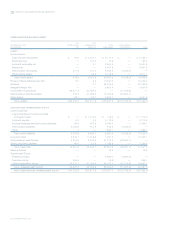
CONSOLIDATING STATEMENT OF CASH FLOWS
TYCO TYCO
YEAR ENDED SEPTEMBER 30, 2003 INTERNATIONAL INTERNATIONAL OTHER CONSOLIDATING
($ IN MILLIONS) LTD. GROUP S.A. SUBSIDIARIES ADJUSTMENTS TOTAL
CASH FLOWS FROM OPERATING ACTIVITIES:
Net cash provided by operating activities from
continuing operations $«1,171.4 $««««623.5 $«3,551.2 $÷÷÷÷«— $«5,346.1
Net cash provided by operating activities from
discontinued operations — — 20.0 — 20.0
Net cash provided by operating activities 1,171.4 623.5 3,571.2 — 5,366.1
CASH FLOWS FROM INVESTING ACTIVITIES:
Sale (purchase) of property, plant and equipment, net 4.0 — (1,173.6) — (1,169.6)
Construction of Tyco Global Network — — (112.7) — (112.7)
Acquisition of businesses, net of cash acquired — — (44.0) — (44.0)
Acquisition of customer accounts (ADT dealer program) — — (596.8) — (596.8)
Cash paid for purchase accounting and
holdback/earn-out liabilities — — (271.8) — (271.8)
Disposal of businesses, net of cash sold — — 8.5 — 8.5
Cash invested in short-term investments — (331.4) (60.7) — (392.1)
Net sales (purchases) of long-term investments 0.1 (45.3) 54.4 — 9.2
Net decrease in intercompany loans — 2,657.6 — (2,657.6) —
Net increase in investment in subsidiaries (2.4) (0.5) — 2.9 —
Increase in current and non-current restricted cash — (134.4) (94.0) — (228.4)
Other — (8.6) 66.3 — 57.7
Net cash provided by (used in) investing activities 1.7 2,137.4 (2,224.4) (2,654.7) (2,740.0)
CASH FLOWS FROM FINANCING ACTIVITIES:
Net repayments of debt (1,062.8) (3,449.7) (106.1) — (4,618.6)
Proceeds from exercise of options — — 14.8 — 14.8
Dividends paid (100.9) — — — (100.9)
Repurchase of Tyco common shares — — (1.2) — (1.2)
Net financing repayments to parent — — (2,657.6) 2,657.6 —
Net capital contributions from parent 2.9 (2.9) —
Other — — (8.0) — (8.0)
Net cash used in financing activities (1,163.7) (3,449.7) (2,755.2) 2,654.7 (4,713.9)
Effect of currency translation on cash — — 88.8 — 88.8
NET INCREASE (DECREASE) IN CASH AND CASH EQUIVALENTS 9.4 (688.8) (1,319.6) — (1,999.0)
CASH AND CASH EQUIVALENTS AT BEGINNING OF YEAR 37.6 2,970.7 3,177.4 — 6,185.7
CASH AND CASH EQUIVALENTS AT END OF YEAR $÷÷÷47.0 $«2,281.9 $«1,857.8 $÷÷÷÷«— $«4,186.7
TYCO INTERNATIONAL LTD.