ADT 2003 Annual Report Download - page 85
Download and view the complete annual report
Please find page 85 of the 2003 ADT annual report below. You can navigate through the pages in the report by either clicking on the pages listed below, or by using the keyword search tool below to find specific information within the annual report.-
 1
1 -
2
-
3
-
4
-
5
-
6
-
7
-
8
-
9
-
10
-
11
-
12
-
13
-
14
-
15
-
16
-
17
-
18
-
19
-
20
-
21
-
22
-
23
-
24
-
25
-
26
-
27
-
28
-
29
-
30
-
31
-
32
-
33
-
34
-
35
-
36
-
37
-
38
-
39
-
40
-
41
-
42
-
43
-
44
-
45
-
46
-
47
-
48
-
49
-
50
-
51
-
52
-
53
-
54
-
55
-
56
-
57
-
58
-
59
-
60
-
61
-
62
-
63
-
64
-
65
-
66
-
67
-
68
-
69
-
70
-
71
-
72
-
73
-
74
-
 75
75 -
 76
76 -
 77
77 -
 78
78 -
 79
79 -
 80
80 -
 81
81 -
 82
82 -
 83
83 -
 84
84 -
 85
85 -
 86
86 -
 87
87 -
 88
88 -
 89
89 -
 90
90 -
 91
91 -
 92
92 -
 93
93 -
 94
94 -
 95
95 -
96
-
97
-
98
-
99
-
100
-
101
-
102
-
103
-
104
-
105
-
106
-
107
-
108
-
109
-
110
-
111
-
112
-
113
-
114
-
115
-
116
-
117
-
118
-
119
-
120
-
121
-
122
-
123
-
124
-
125
-
126
-
127
-
128
-
129
-
130
-
131
-
132
 |
 |

83
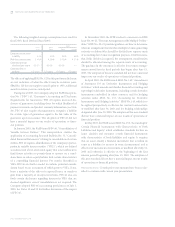
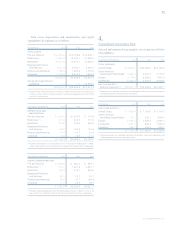
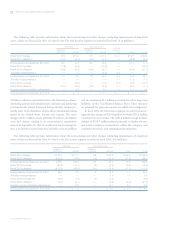
Total assets, depreciation and amortization, and capital
expenditures by segment are as follows:
SEPTEMBER 30, 2003 2002 2001
TOTAL ASSETS:
Fire and Security $19,423.0 $19,728.8 $15,008.7
Electronics (1) 17,392.4 18,187.1 21,605.6
Healthcare 13,177.0 13,274.7 13,583.0
Engineered Products
and Services 7,097.3 6,632.7 6,305.2
Plastics and Adhesives 1,735.3 1,800.6 1,720.3
Corporate 4,720.0 5,875.9 1,592.4
63,545.0 65,499.8 59,815.2
Net assets of discontinued
operations —— 10,598.0
$63,545.0 $65,499.8 $70,413.2
(1) Includes total assets (excluding cash which is not held for sale) for the TGN business
of $47.5 million, $642.2 million and $2,657.3 million at September 30,2003, 2002
and 2001, respectively.
YEAR ENDED SEPTEMBER 30, 2003 2002 2001
DEPRECIATION AND
AMORTIZATION:
Fire and Security $1,201.6 $1,047.0 $«««767.8
Electronics (1) 517.8 546.5 721.0
Healthcare 313.0 310.6 459.8
Engineered Products
and Services 108.2 126.9 172.4
Plastics and Adhesives 47.4 41.7 52.9
Corporate 8.9 12.3 11.1
$2,196.9 $2,085.0 $2,185.0
(1) Includes depreciation and amortization for the TGN business totaling $37.1 million,
$28.9 million and $15.8 million for fiscal 2003, fiscal 2002 and fiscal 2001, respectively.
YEAR ENDED SEPTEMBER 30, 2003 2002 2001
CAPITAL EXPENDITURES, NET:
Fire and Security $«««509.8 $«««820.4 $«««866.1
Electronics (1) 515.7 1,597.9 2,922.7
Healthcare 192.4 273.1 248.8
Engineered Products
and Services 50.1 78.7 32.7
Plastics and Adhesives 22.0 31.7 (89.2)
Corporate (7.7) 23.0 40.0
$1,282.3 $2,824.8 $4,021.1
(1) Includes capital expenditures, net for the TGN business of $120.7 million, $1,146.0 mil-
lion and $2,219.4 million for fiscal 2003, fiscal 2002 and fiscal 2001, respectively.
4.
Consolidated Geographic Data
Selected information by geographic area is presented below
($ in millions).
YEAR ENDED SEPTEMBER 30, 2003 2002 2001
TOTAL REVENUES:
United States $19,838.7 $20,308.2 $19,728.0
Other Americas
(excluding United States) 1,844.3 2,007.2 2,176.6
Europe 9,719.0 8,358.2 7,591.0
Asia-Pacific 5,399.3 4,916.2 4,506.5
Net revenues from
external customers (1) $36,801.3 $35,589.8 $34,002.1
(1) Revenues from external customers are attributed to individual countries based on
the reporting entity that records the transaction.
SEPTEMBER 30, 2003 2002 2001
LONG-LIVED ASSETS (1) :
United States $««7,059.3 $««7,196.5 $««5,754.7
Other Americas
(excluding United States) 715.7 425.7 1,659.4
Europe 2,450.2 2,606.3 4,325.2
Asia-Pacific 904.1 905.6 1,069.2
Corporate 286.7 455.2 620.1
$11,416.0 $11,589.3 $13,428.6
(1) Long-lived assets are comprised primarily of property, plant and equipment and
exclude goodwill and other intangible assets.
TYCO INTERNATIONAL LTD.