ADT 2003 Annual Report Download - page 51
Download and view the complete annual report
Please find page 51 of the 2003 ADT annual report below. You can navigate through the pages in the report by either clicking on the pages listed below, or by using the keyword search tool below to find specific information within the annual report.-
 1
1 -
2
-
3
-
4
-
5
-
6
-
7
-
8
-
9
-
10
-
11
-
12
-
13
-
14
-
15
-
16
-
17
-
18
-
19
-
20
-
21
-
22
-
23
-
24
-
25
-
26
-
27
-
28
-
29
-
30
-
31
-
32
-
33
-
34
-
35
-
36
-
37
-
38
-
39
-
40
-
 41
41 -
 42
42 -
 43
43 -
 44
44 -
 45
45 -
 46
46 -
 47
47 -
 48
48 -
 49
49 -
 50
50 -
 51
51 -
 52
52 -
 53
53 -
 54
54 -
 55
55 -
 56
56 -
 57
57 -
 58
58 -
 59
59 -
 60
60 -
 61
61 -
62
-
63
-
64
-
65
-
66
-
67
-
68
-
69
-
70
-
71
-
72
-
73
-
74
-
75
-
76
-
77
-
78
-
79
-
80
-
81
-
82
-
83
-
84
-
85
-
86
-
87
-
88
-
89
-
90
-
91
-
92
-
93
-
94
-
95
-
96
-
97
-
98
-
99
-
100
-
101
-
102
-
103
-
104
-
105
-
106
-
107
-
108
-
109
-
110
-
111
-
112
-
113
-
114
-
115
-
116
-
117
-
118
-
119
-
120
-
121
-
122
-
123
-
124
-
125
-
126
-
127
-
128
-
129
-
130
-
131
-
132
 |
 |

49
make selected complementary acquisitions, the amount of
acquisition activity has been significantly reduced and, there-
fore, our growth rate from acquisitions has been reduced as
compared to prior periods.
Total debt as a percentage of total capitalization (total debt
and shareholders’ equity) was 44% at September 30, 2003 and
50% at September 30, 2002. We had approximately $4.2 billion
of cash and cash equivalents as of September 30, 2003. Net debt
(total debt less cash and cash equivalents) as a percent of net
capitalization (net debt and shareholders’ equity) was 39% at
September 30, 2003 and 43% at September 30, 2002. Manage-
ment believes net debt is an important measure of liquidity which
it uses to measure its ability to meet its future debt obligations.
At September 30, 2003, total debt was $20,969.1 million, as
compared to $24,248.1 million at September 30, 2002. This
decrease resulted principally from the repayment of Tyco
International Group S.A.’s (“TIG”), a wholly-owned subsidiary
of Tyco, $3.855 billion unsecured term loan, the repurchase of
TIG’s $750 million par value 6.25% Dealer Remarketable
Securities due 2013, the repurchase of TIG’s remaining Floating
Rate Notes and 4.95% Notes of approximately $488 million
and $534 million, respectively, the purchase of $1,850.1 million
(par value $2,421.1 million) of TIG’s zero coupon convertible
debentures due 2021 for cash of $1,850.1 million, and the pur-
chase of $1,085.7 million (par value $1,415.2 million) of Tyco’s
zero coupon convertible debentures due 2020 for cash of
approximately $1,062.8 million. The decrease was partially off-
set by the issuance of $3.0 billion of 2.75% Series A convertible
senior debentures due January 2018 and $1.5 billion of 3.125%
Series B convertible senior debentures due January 2023 for net
proceeds of approximately $4,387.5 million. Our debt activity
is discussed in more detail below. Our cash balance decreased
to $4,186.7 million at September 30, 2003, as compared to
$6,185.7 million at September 30, 2002.
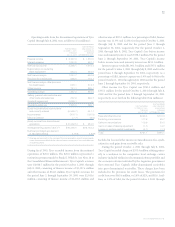
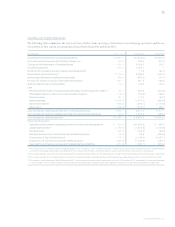
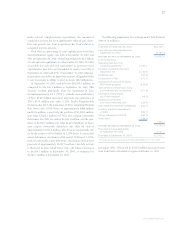
The following summarizes Tyco’s change in net debt for fiscal
2003 ($ in millions):
Total debt at September 30, 2002 $24,248.1
Less: cash and cash equivalents at
September 30, 2002 (6,185.7)
NET DEBT BALANCE AT SEPTEMBER 30, 2002 18,062.4
Less the following:
Operating cash flow from
continuing operations (1) 5,346.1
Purchase of property, plant and
equipment, net (1,169.6)
Dividends paid (100.9)
Construction of TGN (112.7)
Acquisition of customer accounts
(ADT dealer program) (596.8)
Cash paid for purchase accounting
and holdback/earn-out liabilities (271.8)
Acquisition of businesses,
net of cash acquired (44.0)
Increase in current and
non-current restricted cash (228.4)
Cash invested in short-term investments (392.1)
Currency translation adjustments
on debt (352.7)
Impact of adoption of FIN 46 (562.2)
Other items (234.9)
1,280.0
NET DEBT BALANCE AT SEPTEMBER 30, 2003 16,782.4
Plus: cash and cash equivalents
at September 30, 2003 4,186.7
Total debt at September 30, 2003 $20,969.1
(1) Includes decrease in sales of accounts receivable programs of $119.0 million.
In January 2003, TIG repaid its $3,855 million unsecured term
loan from banks scheduled to expire on February 6, 2003.
TYCO INTERNATIONAL LTD.