ADT 2003 Annual Report Download - page 130
Download and view the complete annual report
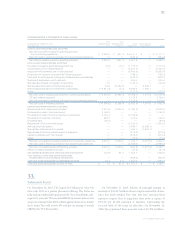
Please find page 130 of the 2003 ADT annual report below. You can navigate through the pages in the report by either clicking on the pages listed below, or by using the keyword search tool below to find specific information within the annual report.-
 1
1 -
2
-
3
-
4
-
5
-
6
-
7
-
8
-
9
-
10
-
11
-
12
-
13
-
14
-
15
-
16
-
17
-
18
-
19
-
20
-
21
-
22
-
23
-
24
-
25
-
26
-
27
-
28
-
29
-
30
-
31
-
32
-
33
-
34
-
35
-
36
-
37
-
38
-
39
-
40
-
41
-
42
-
43
-
44
-
45
-
46
-
47
-
48
-
49
-
50
-
51
-
52
-
53
-
54
-
55
-
56
-
57
-
58
-
59
-
60
-
61
-
62
-
63
-
64
-
65
-
66
-
67
-
68
-
69
-
70
-
71
-
72
-
73
-
74
-
75
-
76
-
77
-
78
-
79
-
80
-
81
-
82
-
83
-
84
-
85
-
86
-
87
-
88
-
89
-
90
-
91
-
92
-
93
-
94
-
95
-
96
-
97
-
98
-
99
-
100
-
101
-
102
-
103
-
104
-
105
-
106
-
107
-
108
-
109
-
110
-
111
-
112
-
113
-
114
-
115
-
116
-
117
-
118
-
119
-
 120
120 -
 121
121 -
 122
122 -
 123
123 -
 124
124 -
 125
125 -
 126
126 -
 127
127 -
 128
128 -
 129
129 -
 130
130 -
 131
131 -
 132
132
 |
 |

128
TYCO INTERNATIONAL LTD.
Common Shares and Dividends
The number of registered holders of Tyco’s common shares at December 2, 2003 was 51,262.
Tyco common shares are listed and traded on the New York Stock Exchange (“NYSE”) and the Bermuda Stock Exchange under
the symbol “TYC.” The following table sets forth the high and low sales prices per Tyco common share as reported by the NYSE,
and the dividends paid on Tyco common shares, for the quarterly periods presented below. As of December 12, 2003, Tyco delisted
its common shares from the Official List of the UK Listing Authority and from trading on the London Stock Exchange plc. Tyco
common shares will continue to be listed on the New York Stock Exchange and on the Bermuda Stock Exchange.
YEAR ENDED SEPTEMBER 30, 2003 YEAR ENDED SEPTEMBER 30, 2002
MARKET PRICE RANGE DIVIDEND PER MARKET PRICE RANGE DIVIDEND PER
QUARTER HIGH LOW COMMON SHARE HIGH LOW COMMON SHARE
First $18.7000 $11.9000 $0.0125 $60.0900 $44.7000 $0.0125
Second 18.3400 11.2000 0.0125 58.8000 22.0000 0.0125
Third 20.2000 12.8400 0.0125 32.6000 8.3000 0.0125
Fourth 22.0000 17.7500 0.0125 18.4500 7.0000 0.0125
$0.0500 $0.0500
Dividend Policy
We may from time to time enter into financing agreements that contain financial covenants and restrictions, some of which may
limit the ability of Tyco to pay dividends. Future dividends on our common shares, if any, will be at the discretion of Tyco’s Board
of Directors and will depend on, among other things, our results of operations, cash requirements and surplus, financial condition,
contractual restrictions and other factors that the Board of Directors may deem relevant.
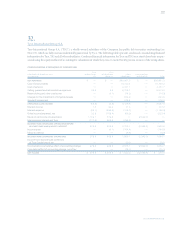
Free Cash Flow Reconciliation
($ IN MILLIONS) FISCAL 2003
Cash provided by operating activities
from continuing operations «$5,346.1
Capital expenditures, net (1,169.6)
Dividends paid (100.9)
Decrease in sale of accounts receivable programs 119.0
Construction of Tyco Global Network (112.7)
Acquisition of customer accounts (ADT dealer program) (596.8)
Cash paid for purchase accounting and
holdback/earn-out liabilities (271.8)
FREE CASH FLOW $«3,213.3
Free cash flow (“FCF”) is a non-GAAP metric and should not
be considered a replacement for GAAP results. Investors are
urged to read the Company’s financial statements as filed with
the Securities and Exchange Commission. The measure should
be used in conjunction with other GAAP financial measures
and is not presented as alternative measure of cash flow as cal-
culated and presented in accordance with GAAP. Investors
should not rely on FCF as a substitute for any GAAP financial
measure. FCF as presented herein may not be comparable to
similarly titled measures reported by other companies. FCF has
limitations due to the fact that it does not represent the residual
cash flow available for discretionary expenditures.
FCF is used by the Company to measure its ability to meet
its future debt obligations and is a significant measurement
tool in the Company’s incentive compensation plans. The
Company believes that FCF is an important measure of the
Company’s management of cash flow and operating perform-
ance. The difference between Cash from Operating Activities
(the most comparable GAAP measure) and FCF (the non-
GAAP measure) consists of significant cash outflows that the
Company believes are useful to measure its operations. The dif-
ference reflects net capital expenditures, acquisition of customer
accounts (ADT Dealer Program), Tyco Global Network spend-
ing, cash paid for purchase accounting and holdback/earn-out
liabilities from prior acquisitions, dividends paid, and the
impact from the sale of accounts receivable programs. These
items, particularly net capital expenditures and acquisition of
dealer accounts, are integral to the Company’s operations and
deducting these items provides a better picture in management’s
view of cash available for other uses including debt retirement.