ADT 2003 Annual Report Download - page 84
Download and view the complete annual report
Please find page 84 of the 2003 ADT annual report below. You can navigate through the pages in the report by either clicking on the pages listed below, or by using the keyword search tool below to find specific information within the annual report.-
 1
1 -
2
-
3
-
4
-
5
-
6
-
7
-
8
-
9
-
10
-
11
-
12
-
13
-
14
-
15
-
16
-
17
-
18
-
19
-
20
-
21
-
22
-
23
-
24
-
25
-
26
-
27
-
28
-
29
-
30
-
31
-
32
-
33
-
34
-
35
-
36
-
37
-
38
-
39
-
40
-
41
-
42
-
43
-
44
-
45
-
46
-
47
-
48
-
49
-
50
-
51
-
52
-
53
-
54
-
55
-
56
-
57
-
58
-
59
-
60
-
61
-
62
-
63
-
64
-
65
-
66
-
67
-
68
-
69
-
70
-
71
-
72
-
73
-
 74
74 -
 75
75 -
 76
76 -
 77
77 -
 78
78 -
 79
79 -
 80
80 -
 81
81 -
 82
82 -
 83
83 -
 84
84 -
 85
85 -
 86
86 -
 87
87 -
 88
88 -
 89
89 -
 90
90 -
 91
91 -
 92
92 -
 93
93 -
 94
94 -
95
-
96
-
97
-
98
-
99
-
100
-
101
-
102
-
103
-
104
-
105
-
106
-
107
-
108
-
109
-
110
-
111
-
112
-
113
-
114
-
115
-
116
-
117
-
118
-
119
-
120
-
121
-
122
-
123
-
124
-
125
-
126
-
127
-
128
-
129
-
130
-
131
-
132
 |
 |

82
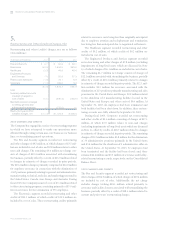
3.
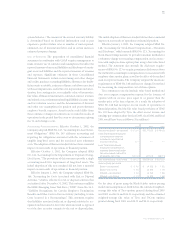
Consolidated Segment Data
The Company’s reportable segments are strategic business units
that operate in different industries and are managed separately.
Certain corporate expenses were allocated to each operating
segment’s operating income, based generally on net revenues.
For additional information, including a description of the
products and services included in each segment, see Note 1.
During fiscal 2003, a change was made to the Company’s
internal reporting structure such that the operations of Tyco’s
plastics and adhesives businesses (previously reported within
the Healthcare and Specialty Products segment) now comprise
the Company’s new Plastics and Adhesives reportable segment.
The Company has conformed its segment reporting accordingly
and has reclassified comparative prior period information to
reflect this change.
In fiscal 2002, Tyco sold its financial services business (Tyco
Capital) through an initial public offering (“IPO”). The histori-
cal results of our financial services business are presented as
“Discontinued Operations.” See Note 11 for more information
regarding the discontinued operations of Tyco Capital. The
Company has conformed its segment reporting accordingly
and has reclassified comparative prior period information to
reflect these changes.
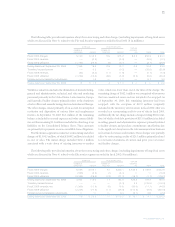
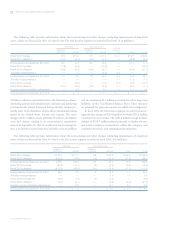
Selected information by industry segment is presented in
the following tables ($ in millions). Amounts include restruc-
turing and other (credits) charges, charges for the impairment
of long-lived assets, charges for the write off of purchased in-
process research and development (“IPR&D”), charges for the
impairment of goodwill, and charges related to changes in esti-
mate recorded during the quarter ended March 31, 2003, as
described in Notes 5, 6, 7, 17 and 31, respectively.
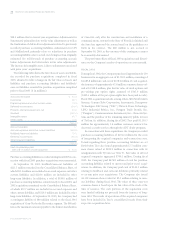
YEAR ENDED SEPTEMBER 30, 2003 2002 2001
NET REVENUES:
Fire and Security $11,292.8 $10,639.0 $««7,473.0
Electronics (1) 10,355.0 10,464.1 13,545.6
Healthcare 8,571.9 7,899.1 7,065.3
Engineered Products
and Services 4,684.4 4,709.3 4,170.8
Plastics and Adhesives 1,897.2 1,878.3 1,747.4
Net revenues from
external customers $36,801.3 $35,589.8 $34,002.1
(1) Includes net revenues for the TGN business of $14.4 million, $8.0 million and $1.7
million in fiscal 2003, fiscal 2002 and fiscal 2001, respectively.
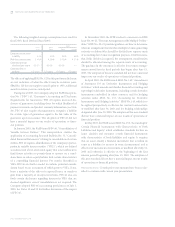
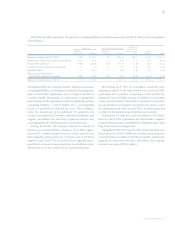
YEAR ENDED SEPTEMBER 30, 2003 2002 2001
OPERATING INCOME (LOSS):
Fire and Security $«««360.2 $««««904.7 $«««883.2
Electronics (1) 457.7 (4,245.9) 3,005.1
Healthcare 2,127.1 1,846.8 1,509.3
Engineered Products
and Services 355.2 252.5 704.8
Plastics and Adhesives 167.4 209.2 300.9
3,467.6 (1,032.7) 6,403.3
Less: Corporate expenses (400.6) (419.7) (243.9)
Goodwill amortization
expense —— (543.0)
Operating income (loss) $3,067.0 $(1,452.4) $5,616.4
(1) Includes operating loss for the TGN business of $799.8 million, $3,125.7 million and
$58.0 million in fiscal 2003, fiscal 2002 and fiscal 2001, respectively.
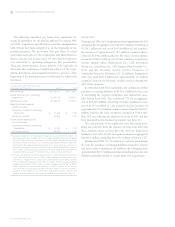
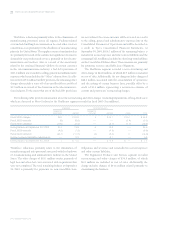
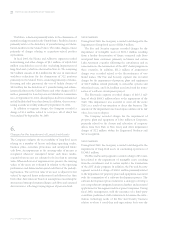
Revenue by groups of products within Tyco’s segments
are as follows:
YEAR ENDED SEPTEMBER 30, 2003 2002 2001
REVENUE BY GROUPS
OF PRODUCTS:
Electronic Security
Services $««6,361.6 $««5,991.9 $««3,696.4
Fire Protection Contracting
and Services 4,931.2 4,647.1 3,776.6
Electronic Components 8,093.0 7,581.1 8,919.5
Wireless 771.5 811.7 673.1
Electrical Contracting
Services 369.6 346.3 335.7
Power Systems 567.7 623.0 918.3
Printed Circuit Group 402.8 416.2 863.0
Submarine
Telecommunications (1) 150.4 685.8 1,836.0
Medical Devices & Supplies 6,694.9 6,252.8 5,983.2
Retail 903.8 762.9 318.3
Pharmaceuticals 973.2 883.4 763.8
Flow Control and
Fire Products 2,717.1 2,789.0 2,252.9
Electrical and
Metal Products 1,349.5 1,434.4 1,397.9
Infrastructure Services 617.8 485.9 520.0
Plastics 999.8 950.4 835.5
A&E Products 296.2 321.6 343.3
Adhesives 343.3 348.0 331.9
Ludlow Coated Products 257.9 258.3 226.8
ADT Automotive ——9.9
Net revenues from
external customers $36,801.3 $35,589.8 $34,002.1
(1) Includes net revenues for the TGN business of $14.4 million, $8.0 million and $1.7 mil-
lion in fiscal 2003, fiscal 2002 and fiscal 2001, respectively.
TYCO INTERNATIONAL LTD.
Notes to Consolidated Financial Statements