ADT 2003 Annual Report Download - page 123
Download and view the complete annual report
Please find page 123 of the 2003 ADT annual report below. You can navigate through the pages in the report by either clicking on the pages listed below, or by using the keyword search tool below to find specific information within the annual report.-
 1
1 -
2
-
3
-
4
-
5
-
6
-
7
-
8
-
9
-
10
-
11
-
12
-
13
-
14
-
15
-
16
-
17
-
18
-
19
-
20
-
21
-
22
-
23
-
24
-
25
-
26
-
27
-
28
-
29
-
30
-
31
-
32
-
33
-
34
-
35
-
36
-
37
-
38
-
39
-
40
-
41
-
42
-
43
-
44
-
45
-
46
-
47
-
48
-
49
-
50
-
51
-
52
-
53
-
54
-
55
-
56
-
57
-
58
-
59
-
60
-
61
-
62
-
63
-
64
-
65
-
66
-
67
-
68
-
69
-
70
-
71
-
72
-
73
-
74
-
75
-
76
-
77
-
78
-
79
-
80
-
81
-
82
-
83
-
84
-
85
-
86
-
87
-
88
-
89
-
90
-
91
-
92
-
93
-
94
-
95
-
96
-
97
-
98
-
99
-
100
-
101
-
102
-
103
-
104
-
105
-
106
-
107
-
108
-
109
-
110
-
111
-
112
-
 113
113 -
 114
114 -
 115
115 -
 116
116 -
 117
117 -
 118
118 -
 119
119 -
 120
120 -
 121
121 -
 122
122 -
 123
123 -
 124
124 -
 125
125 -
 126
126 -
 127
127 -
 128
128 -
 129
129 -
 130
130 -
 131
131 -
 132
132
 |
 |

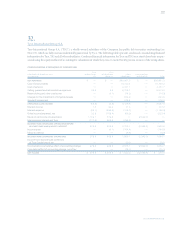
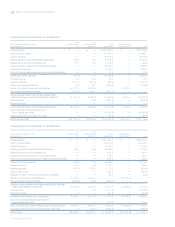
121
CONSOLIDATING BALANCE SHEET
TYCO TYCO
SEPTEMBER 30, 2003 INTERNATIONAL INTERNATIONAL OTHER CONSOLIDATING
($ IN MILLIONS) LTD. GROUP S.A. SUBSIDIARIES ADJUSTMENTS TOTAL
ASSETS
Current Assets:
Cash and cash equivalents $÷÷÷«47.0 $««2,281.9 $««1,857.8 $÷÷÷÷÷÷«— $««4,186.7
Restricted cash — 65.0 76.8 — 141.8
Accounts receivable, net — — 5,714.8 — 5,714.8
Inventories — — 4,292.2 — 4,292.2
Intercompany receivables 111.0 442.7 6,091.8 (6,645.5) —
Other current assets — 431.2 2,472.8 — 2,904.0
Total current assets 158.0 3,220.8 20,506.2 (6,645.5) 17,239.5
Property, Plant and Equipment, Net 0.5 0.2 10,299.1 — 10,299.8
Goodwill — 0.7 25,938.0 — 25,938.7
Intangible Assets, Net — — 5,790.0 — 5,790.0
Investment in Subsidiaries 52,327.9 42,726.9 — (95,054.8) —
Intercompany Loans Receivable 218.3 19,704.8 24,168.2 (44,091.3) —
Other Assets 23.4 502.2 3,751.4 — 4,277.0
TOTAL ASSETS $52,728.1 $66,155.6 $90,452.9 $(145,791.6) $63,545.0
LIABILITIES AND SHAREHOLDERS’ EQUITY
Current Liabilities:
Loans payable and current maturities
of long-term debt $««2,476.5 $««««««««««— $«««««241.9 $«««««««««««««— $««2,718.4
Accounts payable 1.3 0.4 2,715.0 — 2,716.7
Accrued expenses and other current liabilities 50.8 271.3 3,677.0 — 3,999.1
Intercompany payables 5,162.4 929.4 553.7 (6,645.5) —
Other — — 1,138.1 — 1,138.1
Total current liabilities 7,691.0 1,201.1 8,325.7 (6,645.5) 10,572.3
Long-Term Debt — 16,816.7 1,434.0 — 18,250.7
Intercompany Loans Payable 18,615.0 5,553.2 19,923.1 (44,091.3) —
Other Long-Term Liabilities 53.1 — 8,186.6 — 8,239.7
TOTAL LIABILITIES 26,359.1 23,571.0 37,869.4 (50,736.8) 37,062.7
Minority Interest — — 113.3 — 113.3
Shareholders’ Equity:
Preference shares — — 4,680.0 (4,680.0) —
Common shares 403.8 — (4.2) — 399.6
Other shareholders’ equity 25,965.2 42,584.6 47,794.4 (90,374.8) 25,969.4
TOTAL SHAREHOLDERS’ EQUITY 26,369.0 42,584.6 52,470.2 (95,054.8) 26,369.0
TOTAL LIABILITIES AND SHAREHOLDERS’ EQUITY $52,728.1 $66,155.6 $90,452.9 $(145,791.6) $63,545.0
TYCO INTERNATIONAL LTD.