3M 2010 Annual Report Download - page 94
Download and view the complete annual report
Please find page 94 of the 2010 3M annual report below. You can navigate through the pages in the report by either clicking on the pages listed below, or by using the keyword search tool below to find specific information within the annual report.-
 1
1 -
2
-
3
-
4
-
5
-
6
-
7
-
8
-
9
-
10
-
11
-
12
-
13
-
14
-
15
-
16
-
17
-
18
-
19
-
20
-
21
-
22
-
23
-
24
-
25
-
26
-
27
-
28
-
29
-
30
-
31
-
32
-
33
-
34
-
35
-
36
-
37
-
38
-
39
-
40
-
41
-
42
-
43
-
44
-
45
-
46
-
47
-
48
-
49
-
50
-
51
-
52
-
53
-
54
-
55
-
56
-
57
-
58
-
59
-
60
-
61
-
62
-
63
-
64
-
65
-
66
-
67
-
68
-
69
-
70
-
71
-
72
-
73
-
74
-
75
-
76
-
77
-
78
-
79
-
80
-
81
-
82
-
83
-
 84
84 -
 85
85 -
 86
86 -
 87
87 -
 88
88 -
 89
89 -
 90
90 -
 91
91 -
 92
92 -
 93
93 -
 94
94 -
 95
95 -
 96
96 -
 97
97 -
 98
98 -
 99
99 -
 100
100 -
 101
101 -
 102
102 -
 103
103 -
 104
104 -
105
-
106
-
107
-
108
-
109
-
110
-
111
-
112
-
113
-
114
-
115
-
116
-
117
-
118
-
119
-
120
-
121
-
122
-
123
-
124
-
125
-
126
-
127
-
128
-
129
-
130
-
131
-
132
 |
 |

88
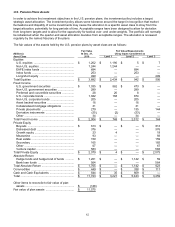
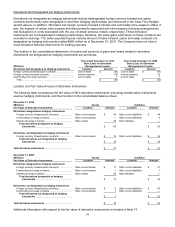
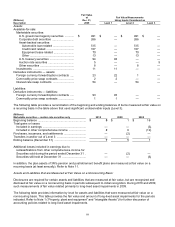
Postretirement Benefit Plans Assets
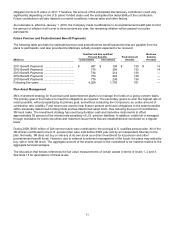
In order to achieve the investment objectives in the U.S. postretirement plan, the investment policy includes a target
strategic asset allocation. The investment policy allows some tolerance around the target in recognition that market
fluctuations and illiquidity of some investments may cause the allocation to a specific asset class to stray from the
target allocation, potentially for long periods of time. Acceptable ranges have been designed to allow for deviation
from long-term targets and to allow for the opportunity for tactical over- and under-weights. The portfolio will normally
be rebalanced when the quarter-end asset allocation deviates from acceptable ranges. The allocation is reviewed
regularly by the named fiduciary of the plan.
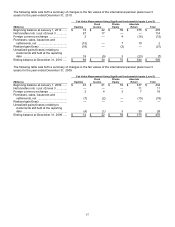
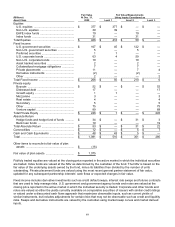
The fair values of the assets held by the postretirement benefits plans by asset class are as follows:
(Millions)
Fair Value
At Dec. 31,
Fair Value Measurements
Using Inputs Considered as
Asset Class
2010
Level 1
Level 2
Level 3
Equities
U.S. equities ...................................................
$
392
$
392
$
—
$
—
Non-U.S. equities ............................................
48
48
—
—
EAFE index funds ...........................................
21
—
21
—
Index funds .....................................................
45
—
45
—
Long/short equity ............................................
16
—
—
16
Total Equities ......................................................
$
522
$
440
$
66
$
16
Fixed Income
U.S. government securities ............................
$
210
$
50
$
160
$
—
Non-U.S. government securities .....................
10
—
10
—
Preferred securities .........................................
1
1
—
—
U.S. corporate bonds ......................................
54
5
49
—
Non-U.S. corporate bonds ..............................
11
—
11
—
Asset backed securities ..................................
3
—
3
—
Collateralized mortgage obligations ...............
7
—
7
—
Private placements .........................................
12
—
8
4
Derivative instruments ....................................
(2
)
—
(2
)
—
Other ...............................................................
2
—
2
—
Total Fixed Income .............................................
$
308
$
56
$
248
$
4
Private Equity
Buyouts ...........................................................
$
57
$
—
$
—
$
57
Distressed debt ...............................................
18
—
—
18
Growth equity ..................................................
1
—
—
1
Mezzanine ......................................................
3
—
—
3
Real estate ......................................................
5
—
—
5
Secondary .......................................................
5
—
—
5
Other ...............................................................
43
—
—
43
Venture capital ................................................
94
—
—
94
Total Private Equity ............................................
$
226
$
—
$
—
$
226
Absolute Return
Hedge funds and hedge fund of funds ...........
$
38
$
—
$
36
$
2
Bank loan funds ..............................................
18
—
—
18
Total Absolute Return .........................................
$
56
$
—
$
36
$
20
Commodities ......................................................
$
14
$
—
$
11
$
3
Cash and Cash Equivalents ...............................
$
43
$
1
$
42
$
—
Total ....................................................................
$
1,169
$
497
$
403
$
269
Other items to reconcile to fair value of plan
assets .............................................................
$
(20
)
Fair value of plan assets ....................................
$
1,149