3M 2010 Annual Report Download - page 89
Download and view the complete annual report
Please find page 89 of the 2010 3M annual report below. You can navigate through the pages in the report by either clicking on the pages listed below, or by using the keyword search tool below to find specific information within the annual report.-
 1
1 -
2
-
3
-
4
-
5
-
6
-
7
-
8
-
9
-
10
-
11
-
12
-
13
-
14
-
15
-
16
-
17
-
18
-
19
-
20
-
21
-
22
-
23
-
24
-
25
-
26
-
27
-
28
-
29
-
30
-
31
-
32
-
33
-
34
-
35
-
36
-
37
-
38
-
39
-
40
-
41
-
42
-
43
-
44
-
45
-
46
-
47
-
48
-
49
-
50
-
51
-
52
-
53
-
54
-
55
-
56
-
57
-
58
-
59
-
60
-
61
-
62
-
63
-
64
-
65
-
66
-
67
-
68
-
69
-
70
-
71
-
72
-
73
-
74
-
75
-
76
-
77
-
78
-
 79
79 -
 80
80 -
 81
81 -
 82
82 -
 83
83 -
 84
84 -
 85
85 -
 86
86 -
 87
87 -
 88
88 -
 89
89 -
 90
90 -
 91
91 -
 92
92 -
 93
93 -
 94
94 -
 95
95 -
 96
96 -
 97
97 -
 98
98 -
 99
99 -
100
-
101
-
102
-
103
-
104
-
105
-
106
-
107
-
108
-
109
-
110
-
111
-
112
-
113
-
114
-
115
-
116
-
117
-
118
-
119
-
120
-
121
-
122
-
123
-
124
-
125
-
126
-
127
-
128
-
129
-
130
-
131
-
132
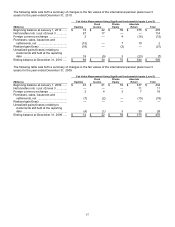
 |
 |

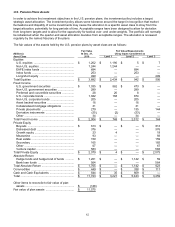
83
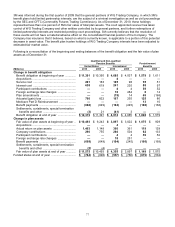
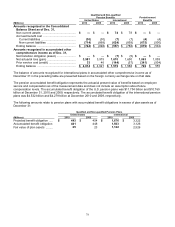
(Millions)
Fair Value
At Dec. 31,
Fair Value Measurements
Using Inputs Considered as
Asset Class
2009
Level 1
Level 2
Level 3
Equities
U.S. equities ...................................................
$
1,215
$
1,206
$
6
$
3
Non-U.S. equities ............................................
1,128
1,128
—
—
EAFE index funds ...........................................
633
—
633
—
Other ...............................................................
7
6
—
1
Total Equities ......................................................
$
2,983
$
2,340
$
639
$
4
Fixed Income
U.S. government securities ............................
$
891
$
610
$
281
$
—
Non-U.S. government securities .....................
165
—
165
—
Preferred and convertible securities ...............
29
20
9
—
U.S. corporate bonds ......................................
1,222
147
1,059
16
Non-U.S. corporate bonds ..............................
175
—
175
—
Asset backed securities ..................................
20
—
20
—
Collateralized mortgage obligations ...............
56
—
56
—
Private placements .........................................
253
—
120
133
Derivative instruments ....................................
(50
)
6
(56
)
—
Other ...............................................................
36
—
—
36
Total Fixed Income .............................................
$
2,797
$
783
$
1,829
$
185
Private Equity
Buyouts ...........................................................
$
569
$
—
$
—
$
569
Distressed debt ...............................................
359
—
—
359
Growth equity ..................................................
32
32
—
—
Mezzanine ......................................................
102
—
—
102
Real estate ......................................................
134
—
—
134
Secondary .......................................................
147
—
—
147
Other ...............................................................
137
4
—
133
Venture capital ................................................
517
—
—
517
Total Private Equity ............................................
$
1,997
$
36
$
—
$
1,961
Absolute Return
Hedge funds and hedge fund of funds ...........
$
1,141
$
—
$
1,038
$
103
Bank loan funds ..............................................
625
—
—
625
Total Absolute Return .........................................
$
1,766
$
—
$
1,038
$
728
Commodities ......................................................
$
396
$
—
$
159
$
237
Cash and Cash Equivalents ...............................
$
696
$
552
$
144
$
—
Total ....................................................................
$
10,635
$
3,711
$
3,809
$
3,115
Other items to reconcile to fair value of plan
assets .............................................................
$
(142
)
Fair value of plan assets ....................................
$
10,493
Publicly traded equities are valued at the closing price reported in the active market in which the individual securities
are traded. Index funds are valued at the net asset value (NAV) as determined by the custodian of the fund. The NAV
is based on the fair value of the underlying assets owned by the fund, minus its liabilities then divided by the number
of units outstanding. Private placement funds are valued using the most recent general partner statement of fair
value, updated for any subsequent partnership interests’ cash flows or expected changes in fair value.
Fixed income includes derivative instruments such as credit default swaps, interest rate swaps and futures contracts
that are used to help manage risks. U.S. government and government agency bonds and notes are valued at the
closing price reported in the active market in which the individual security is traded. Corporate and other bonds and
notes are valued at either the yields currently available on comparable securities of issuers with similar credit ratings
or valued under a discounted cash flows approach that maximizes observable inputs, such as current yields of
similar instruments, but includes adjustments for certain risks that may not be observable such as credit and liquidity
risks. Swaps and derivative instruments are valued by the custodian using closing market swap curves and market
derived inputs.