3M 2010 Annual Report Download - page 35
Download and view the complete annual report
Please find page 35 of the 2010 3M annual report below. You can navigate through the pages in the report by either clicking on the pages listed below, or by using the keyword search tool below to find specific information within the annual report.-
 1
1 -
2
-
3
-
4
-
5
-
6
-
7
-
8
-
9
-
10
-
11
-
12
-
13
-
14
-
15
-
16
-
17
-
18
-
19
-
20
-
21
-
22
-
23
-
24
-
 25
25 -
 26
26 -
 27
27 -
 28
28 -
 29
29 -
 30
30 -
 31
31 -
 32
32 -
 33
33 -
 34
34 -
 35
35 -
 36
36 -
 37
37 -
 38
38 -
 39
39 -
 40
40 -
 41
41 -
 42
42 -
 43
43 -
 44
44 -
 45
45 -
46
-
47
-
48
-
49
-
50
-
51
-
52
-
53
-
54
-
55
-
56
-
57
-
58
-
59
-
60
-
61
-
62
-
63
-
64
-
65
-
66
-
67
-
68
-
69
-
70
-
71
-
72
-
73
-
74
-
75
-
76
-
77
-
78
-
79
-
80
-
81
-
82
-
83
-
84
-
85
-
86
-
87
-
88
-
89
-
90
-
91
-
92
-
93
-
94
-
95
-
96
-
97
-
98
-
99
-
100
-
101
-
102
-
103
-
104
-
105
-
106
-
107
-
108
-
109
-
110
-
111
-
112
-
113
-
114
-
115
-
116
-
117
-
118
-
119
-
120
-
121
-
122
-
123
-
124
-
125
-
126
-
127
-
128
-
129
-
130
-
131
-
132
 |
 |

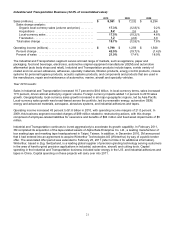
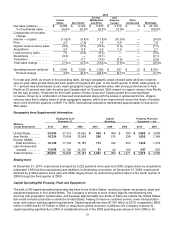
29
2009
United
States
Asia Pacific
Europe,
Middle East
and Africa
Latin
America/
Canada
Other
Unallocated
Worldwide
Net sales (millions) ........
$
8,509
$
6,120
$
5,972
$
2,516
$
6
$
23,123
% of worldwide sales ....
36.8
%
26.5
%
25.8
%
10.9
%
—
100.0
%
Components of net sales
change:
Volume — organic ........
(11.9
)%
(3.4
)%
(11.9
)%
(10.0
)%
—
(9.5
)%
Price ....................
2.5
(1.9
)
1.9
8.6
—
1.8
Organic local-currency sales
(9.4
)
(5.3
)
(10.0
)
(1.4
)
—
(7.7
)
Acquisitions ..............
2.4
0.5
3.5
1.4
—
2.1
Local-currency sales ......
7.0
(4.8
)
(6.5
)
—
—
(5.6
)
Divestitures ..............
(0.3
)
—
(0.1
)
—
—
(0.1
)
Translation ...............
—
0.1
(7.4
)
(7.6
)
—
(2.8
)
Total sales change ........
(7.3
)%
(4.7
)%
(14.0
)%
(7.6
)%
—
(8.5
)%
Operating income (millions) .
$
1,640
$
1,528
$
1,003
$
631
$
12
$
4,814
Percent change .........
3.9
%
(8.1
)%
(22.5
)%
(9.1
)%
—
(7.7
)%
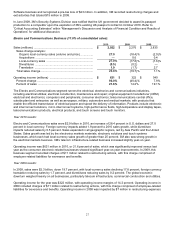
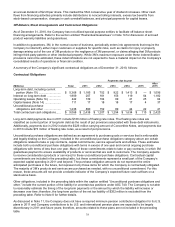
For total year 2009, as shown in the preceding table, all major geographic areas showed sales declines; however,
year-on-year sales growth improved each quarter throughout the year. In the fourth quarter of 2009, sales growth of
11.1 percent was broad-based. Every major geographic region expanded sales, with strong performances in Asia
Pacific at 22 percent and Latin America and Canada each at 19 percent. With respect to organic volume, Asia Pacific
led the way at nearly 19 percent for the fourth quarter. Korea, China and Taiwan posted the most significant
increases, driven by a combination of improved local demand along with the pickup in global electronics. Organic
volumes were flat to slightly down in other geographic regions, which is an improvement versus the levels of decline
seen in the first three quarters of 2009. For 2009, international operations represented approximately 63 percent of
3M’s sales.
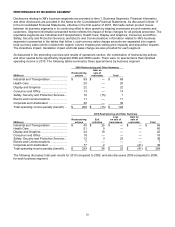
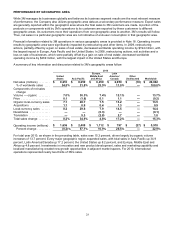
Geographic Area Supplemental Information
Employees as of
December 31,
Capital
Spending
Property, Plant and
Equipment — net
(Millions,
except Employees)
2010
2009
2008
2010
2009
2008
2010
2009
United States ...........
32,955
31,513
33,662
$
569
$
464
$
780
$
3,888
$
3,809
Asia Pacific ..............
16,324
13,834
13,960
290
215
338
1,605
1,366
Europe, Middle
East and Africa ....
18,120
17,743
19,185
151
162
253
1,239
1,318
Latin America and
Canada ................
12,658
11,745
12,376
81
62
100
547
507
Total Company ........
80,057
74,835
79,183
$
1,091
$
903
$
1,471
$
7,279
$
7,000
Employment:
At December 31, 2010, employment increased by 5,222 positions since year-end 2009, largely driven by acquisitions
(estimated 1,850 full-time equivalents) and additions in developing economies. At December 31, 2009, employment
declined by 4,348 positions since year-end 2008, largely driven by restructuring actions taken in the fourth quarter of
2008 through the third quarter of 2009.
Capital Spending/Net Property, Plant and Equipment:
The bulk of 3M capital spending historically has been in the United States, resulting in higher net property, plant and
equipment balances in the United States. The Company is striving to more closely align its manufacturing and
sourcing with geographic market sales, and because approximately two-thirds of sales are outside the United States,
this would increase production outside the United States, helping to improve customer service, lower transportation
costs, and reduce working capital requirements. Capital expenditures were $1.091 billion in 2010, compared to $903
million in 2009 and $1.471 billion in 2008. In response to global economic conditions, the Company reduced its
capital spending significantly in 2009. A substantial amount of the 2009 spending was carryover from 2008 or for