3M 2010 Annual Report Download - page 101
Download and view the complete annual report
Please find page 101 of the 2010 3M annual report below. You can navigate through the pages in the report by either clicking on the pages listed below, or by using the keyword search tool below to find specific information within the annual report.-
 1
1 -
2
-
3
-
4
-
5
-
6
-
7
-
8
-
9
-
10
-
11
-
12
-
13
-
14
-
15
-
16
-
17
-
18
-
19
-
20
-
21
-
22
-
23
-
24
-
25
-
26
-
27
-
28
-
29
-
30
-
31
-
32
-
33
-
34
-
35
-
36
-
37
-
38
-
39
-
40
-
41
-
42
-
43
-
44
-
45
-
46
-
47
-
48
-
49
-
50
-
51
-
52
-
53
-
54
-
55
-
56
-
57
-
58
-
59
-
60
-
61
-
62
-
63
-
64
-
65
-
66
-
67
-
68
-
69
-
70
-
71
-
72
-
73
-
74
-
75
-
76
-
77
-
78
-
79
-
80
-
81
-
82
-
83
-
84
-
85
-
86
-
87
-
88
-
89
-
90
-
 91
91 -
 92
92 -
 93
93 -
 94
94 -
 95
95 -
 96
96 -
 97
97 -
 98
98 -
 99
99 -
 100
100 -
 101
101 -
 102
102 -
 103
103 -
 104
104 -
 105
105 -
 106
106 -
 107
107 -
 108
108 -
 109
109 -
 110
110 -
 111
111 -
112
-
113
-
114
-
115
-
116
-
117
-
118
-
119
-
120
-
121
-
122
-
123
-
124
-
125
-
126
-
127
-
128
-
129
-
130
-
131
-
132
 |
 |
95
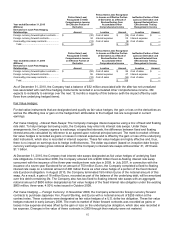
Currency Effects and Credit Risk
Currency Effects: 3M estimates that year-on-year currency effects, including hedging impacts, increased net income
attributable to 3M by approximately $15 million in 2010 and decreased net income attributable to 3M by
approximately $220 million in 2009. This estimate includes the effect of translating profits from local currencies into
U.S. dollars; the impact of currency fluctuations on the transfer of goods between 3M operations in the United States
and abroad; and transaction gains and losses, including derivative instruments designed to reduce foreign currency
exchange rate risks and the negative impact of swapping Venezuelan bolivars into U.S. dollars. 3M estimates that
year-on-year derivative and other transaction gains and losses decreased net income attributable to 3M by
approximately $115 million in 2010 and had an immaterial impact in 2009.
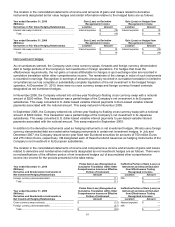
Credit risk: The Company is exposed to credit loss in the event of nonperformance by counterparties in interest rate
swaps, currency swaps, commodity price swaps, and forward and option contracts. However, the Company’s risk is
limited to the fair value of the instruments. The Company actively monitors its exposure to credit risk through the use
of credit approvals and credit limits, and by selecting major international banks and financial institutions as
counterparties. The Company does not anticipate nonperformance by any of these counterparties. 3M has credit
support agreements in place with two of its primary derivatives counterparties. Under these agreements, either party
is required to post eligible collateral when the market value of transactions covered by the agreements exceeds
specified thresholds, thus limiting credit exposure for both parties.
NOTE 13. Fair Value Measurements
3M follows ASC 820, Fair Value Measurements and Disclosures, with respect to assets and liabilities that are
measured at fair value on a recurring basis and nonrecurring basis. Under the standard, fair value is defined as the
exit price, or the amount that would be received to sell an asset or paid to transfer a liability in an orderly transaction
between market participants as of the measurement date. The standard also establishes a hierarchy for inputs used
in measuring fair value that maximizes the use of observable inputs and minimizes the use of unobservable inputs by
requiring that the most observable inputs be used when available. Observable inputs are inputs market participants
would use in valuing the asset or liability developed based on market data obtained from sources independent of the
Company. Unobservable inputs are inputs that reflect the Company’s assumptions about the factors market
participants would use in valuing the asset or liability developed based upon the best information available in the
circumstances. The hierarchy is broken down into three levels. Level 1 inputs are quoted prices (unadjusted) in
active markets for identical assets or liabilities. Level 2 inputs include quoted prices for similar assets or liabilities in
active markets, quoted prices for identical or similar assets or liabilities in markets that are not active, and inputs
(other than quoted prices) that are observable for the asset or liability, either directly or indirectly. Level 3 inputs are
unobservable inputs for the asset or liability. Categorization within the valuation hierarchy is based upon the lowest
level of input that is significant to the fair value measurement.
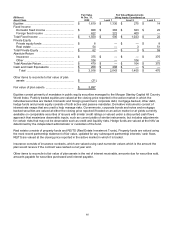
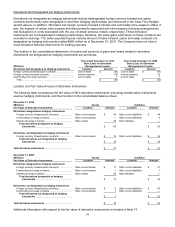
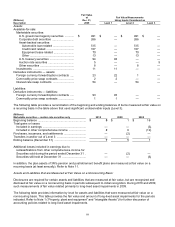
Assets and Liabilities that are Measured at Fair Value on a Recurring Basis:
For 3M, assets and liabilities that are measured at fair value on a recurring basis primarily relate to available-for-sale
marketable securities, available-for-sale investments (included as part of investments in the Consolidated Balance
Sheet) and certain derivative instruments. Derivatives include cash flow hedges, interest rate swaps and most net
investment hedges. The information in the following paragraphs and tables primarily addresses matters relative to
these financial assets and liabilities. Separately, there were no material fair value measurements with respect to
nonfinancial assets or liabilities that are recognized or disclosed at fair value in the Company’s financial statements
on a recurring basis for 2010 and 2009.
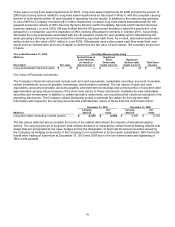
3M uses various valuation techniques, which are primarily based upon the market and income approaches, with
respect to financial assets and liabilities. Following is a description of the valuation methodologies used for the
respective financial assets and liabilities measured at fair value.
Available-for-sale marketable securities — except auction rate securities:
Marketable securities, except auction rate securities, are valued utilizing multiple sources. A weighted average price
is used for these securities. Market prices are obtained for these securities from a variety of industry standard data
providers, security master files from large financial institutions, and other third-party sources. These multiple prices
are used as inputs into a distribution-curve-based algorithm to determine the daily fair value to be used. 3M classifies
U.S. treasury securities as level 1, while all other marketable securities (excluding auction rate securities) are
classified as level 2. Marketable securities are discussed further in Note 9.