3M 2010 Annual Report Download - page 20
Download and view the complete annual report
Please find page 20 of the 2010 3M annual report below. You can navigate through the pages in the report by either clicking on the pages listed below, or by using the keyword search tool below to find specific information within the annual report.-
 1
1 -
2
-
3
-
4
-
5
-
6
-
7
-
8
-
9
-
 10
10 -
 11
11 -
 12
12 -
 13
13 -
 14
14 -
 15
15 -
 16
16 -
 17
17 -
 18
18 -
 19
19 -
 20
20 -
 21
21 -
 22
22 -
 23
23 -
 24
24 -
 25
25 -
 26
26 -
 27
27 -
 28
28 -
 29
29 -
 30
30 -
31
-
32
-
33
-
34
-
35
-
36
-
37
-
38
-
39
-
40
-
41
-
42
-
43
-
44
-
45
-
46
-
47
-
48
-
49
-
50
-
51
-
52
-
53
-
54
-
55
-
56
-
57
-
58
-
59
-
60
-
61
-
62
-
63
-
64
-
65
-
66
-
67
-
68
-
69
-
70
-
71
-
72
-
73
-
74
-
75
-
76
-
77
-
78
-
79
-
80
-
81
-
82
-
83
-
84
-
85
-
86
-
87
-
88
-
89
-
90
-
91
-
92
-
93
-
94
-
95
-
96
-
97
-
98
-
99
-
100
-
101
-
102
-
103
-
104
-
105
-
106
-
107
-
108
-
109
-
110
-
111
-
112
-
113
-
114
-
115
-
116
-
117
-
118
-
119
-
120
-
121
-
122
-
123
-
124
-
125
-
126
-
127
-
128
-
129
-
130
-
131
-
132
 |
 |

14
Sales in 2009 totaled $23.1 billion, a decrease of 8.5 percent from 2008. In 2009, the global economic slowdown
dramatically affected comparisons for 3M’s businesses. Substantial end-market declines and inventory takedowns in
major industries, including automotive, consumer electronics and general industrial manufacturing, resulted in
significantly lower sales and income. Accordingly, 3M reduced its cost structure, lowered manufacturing output and
intensified its attention to operational improvement. The combination of these actions drove operating income
margins of 20.8 percent in 2009, compared to 20.6 percent in 2008. Restructuring charges and other special items
reduced this operating income margin by approximately one percentage point in both 2009 and 2008.
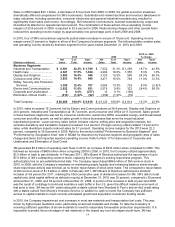
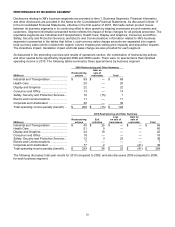
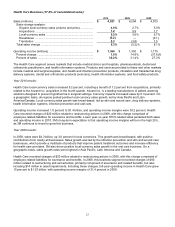
In 2010, four of 3M’s six business segments posted sales increases in excess of 10 percent. Operating income
margins were 21 percent or higher in all six of the Company’s business segments. The following table contains sales
and operating income results by business segment for the years ended December 31, 2010 and 2009.
2010
2009
2010 vs. 2009
% change
(Dollars in millions)
Net
Sales
% of
Total
Oper.
Income
Net
Sales
% of
Total
Oper.
Income
Net
Sales
Oper.
Income
Business Segments
Industrial and Transportation
$
8,581
32.2
%
$
1,799
$
7,232
31.3
%
$
1,259
18.7
%
42.9
%
Health Care ............................
4,521
17.0
%
1,364
4,294
18.6
%
1,350
5.3
%
1.0
%
Display and Graphics .............
3,884
14.6
%
946
3,132
13.5
%
590
24.0
%
60.3
%
Consumer and Office .............
3,853
14.4
%
840
3,471
15.0
%
748
11.0
%
12.3
%
Safety, Security and Protection
Services ..............................
3,308
12.4
%
707
3,064
13.3
%
724
8.0
%
(2.4
)%
Electro and Communications
2,922
11.0
%
631
2,276
9.8
%
322
28.4
%
96.0
%
Corporate and Unallocated ....
9
0.0
%
(277
)
12
0.1
%
(100
)
Elimination of Dual Credit .......
(416
)
(1.6
)%
(92
)
(358
)
(1.6
)%
(79
)
Total Company .......................
$
26,662
100.0
%
$
5,918
$
23,123
100.0
%
$
4,814
15.3
%
22.9
%
In 2010, sales increased 15.3 percent, led by Electro and Communications at 28.4 percent, Display and Graphics at
24.0 percent, Industrial and Transportation at 18.7 percent, and Consumer and Office at 11.0 percent. Sales growth
in these business segments was led by consumer electronics, automotive OEM, renewable energy, and broad-based
consumer and office growth, as well as sales growth in those businesses that serve the broad industrial
manufacturing sector. Local-currency sales (which includes volume, selling price and acquisition impacts, but
excludes divestiture and translation impacts) increased 14.4 percent. Foreign currency effects added 1.0 percent to
sales, while divestiture impacts reduced sales by 0.1 percent. Operating income margins for the 2010 were 22.2
percent, compared to 20.8 percent in 2009. Refer to the section entitled “Performance by Business Segment” and
“Performance by Geographic Area” later in MD&A for discussion by business segment and geographic area of sales
change and items that impacted reported operating income. Refer to Note 17 for discussion of Corporate and
Unallocated and Elimination of Dual Credit.
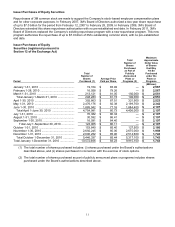
3M generated $5.2 billion of operating cash flows in 2010, an increase of $233 million when compared to 2009. This
followed an increase of $408 million when comparing 2009 to 2008. In 2010, the Company utilized approximately
$1.5 billion of cash to pay dividends. In February 2011, 3M’s Board of Directors authorized the repurchase of up to
$7.0 billion of 3M’s outstanding common stock, replacing the Company’s existing repurchase program. This
authorization has no pre-established end date. The Company repurchased $854 million of 3M common stock in
2010. In 2009, with the Company’s emphasis on maintaining ample liquidity and enhancing balance sheet strength,
share repurchase activity was minimal, as no broker repurchases of stock were made. This compared to repurchases
of 3M common stock of $1.6 billion in 2008. In February 2011, 3M’s Board of Directors authorized a dividend
increase of 4.8 percent for 2011, marking the 53rd consecutive year of dividend increases for 3M. 3M’s debt to total
capital ratio (total capital defined as debt plus equity) at December 31, 2010 was 25 percent, compared to 30 percent
at December 31, 2009, and 39 percent at December 31, 2008. A portion of the increase in debt at year-end 2008
was the result of a strategy to build and maintain a cash buffer in the U.S. given the difficult market environment at
that point in time. 3M has an AA- credit rating with a stable outlook from Standard & Poor’s and an Aa2 credit rating
with a stable outlook from Moody’s Investors Service. In addition to cash on hand, the Company has sufficient
access to capital markets to meet currently anticipated growth and acquisition investment funding needs.
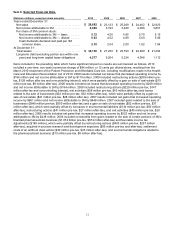
In 2010, the Company experienced cost increases in most raw materials and transportation fuel costs. This was
driven by higher basic feedstock costs, particularly oil-derived materials and metals. To date the Company is
receiving sufficient quantities of all raw materials to meet its reasonably foreseeable production requirements. It is
impossible to predict future shortages of raw materials or the impact any such shortages would have. 3M has