3M 2010 Annual Report Download - page 22
Download and view the complete annual report
Please find page 22 of the 2010 3M annual report below. You can navigate through the pages in the report by either clicking on the pages listed below, or by using the keyword search tool below to find specific information within the annual report.-
 1
1 -
2
-
3
-
4
-
5
-
6
-
7
-
8
-
9
-
10
-
11
-
 12
12 -
 13
13 -
 14
14 -
 15
15 -
 16
16 -
 17
17 -
 18
18 -
 19
19 -
 20
20 -
 21
21 -
 22
22 -
 23
23 -
 24
24 -
 25
25 -
 26
26 -
 27
27 -
 28
28 -
 29
29 -
 30
30 -
 31
31 -
 32
32 -
33
-
34
-
35
-
36
-
37
-
38
-
39
-
40
-
41
-
42
-
43
-
44
-
45
-
46
-
47
-
48
-
49
-
50
-
51
-
52
-
53
-
54
-
55
-
56
-
57
-
58
-
59
-
60
-
61
-
62
-
63
-
64
-
65
-
66
-
67
-
68
-
69
-
70
-
71
-
72
-
73
-
74
-
75
-
76
-
77
-
78
-
79
-
80
-
81
-
82
-
83
-
84
-
85
-
86
-
87
-
88
-
89
-
90
-
91
-
92
-
93
-
94
-
95
-
96
-
97
-
98
-
99
-
100
-
101
-
102
-
103
-
104
-
105
-
106
-
107
-
108
-
109
-
110
-
111
-
112
-
113
-
114
-
115
-
116
-
117
-
118
-
119
-
120
-
121
-
122
-
123
-
124
-
125
-
126
-
127
-
128
-
129
-
130
-
131
-
132
 |
 |

16
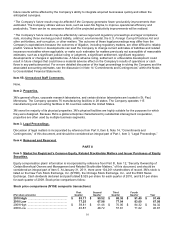
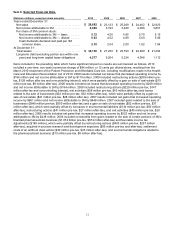
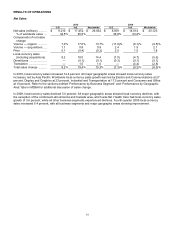
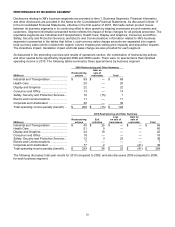
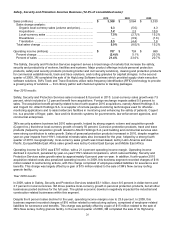
RESULTS OF OPERATIONS
Net Sales:
2010
2009
U.S.
Intl.
Worldwide
U.S.
Intl.
Worldwide
Net sales (millions) ..........
$
9,210
$
17,452
$
26,662
$
8,509
$
14,614
$
23,123
% of worldwide sales ...
34.5
%
65.5
%
36.8
%
63.2
%
Components of net sales
change:
Volume — organic ...........
7.0
%
17.6
%
13.7
%
(11.9
)%
(8.1
)%
(9.5
)%
Volume — acquisitions ....
1.1
0.8
0.9
2.4
1.9
2.1
Price ................................
0.1
(0.4
)
(0.2
)
2.5
1.5
1.8
Local-currency sales
(including acquisitions)
8.2
18.0
14.4
(7.0
)
(4.7
)
(5.6
)
Divestitures ......................
—
(0.1
)
(0.1
)
(0.3
)
(0.1
)
(0.1
)
Translation .......................
—
1.5
1.0
—
(4.4
)
(2.8
)
Total sales change ..........
8.2
%
19.4
%
15.3
%
(7.3
)%
(9.2
)%
(8.5
)%
In 2010, local-currency sales increased 14.4 percent. All major geographic areas showed local-currency sales
increases, led by Asia Pacific. Worldwide local-currency sales growth was led by Electro and Communications at 27
percent, Display and Graphics at 23 percent, Industrial and Transportation at 17.5 percent and Consumer and Office
at 10 percent. Refer to the sections entitled “Performance by Business Segment” and “Performance by Geographic
Area” later in MD&A for additional discussion of sales change.
In 2009, local-currency sales declined 5.6 percent. All major geographic areas showed local-currency declines, with
the exception of the combined Latin America and Canada area, which was flat. Health Care had local-currency sales
growth of 3.6 percent, while all other business segments experienced declines. Fourth-quarter 2009 local-currency
sales increased 6.4 percent, with all business segments and major geographic areas showing improvement.